Immigrants from Laos vs Immigrants from Fiji In Labor Force | Age 30-34
COMPARE
Immigrants from Laos
Immigrants from Fiji
In Labor Force | Age 30-34
In Labor Force | Age 30-34 Comparison
Immigrants from Laos
Immigrants from Fiji
84.2%
IN LABOR FORCE | AGE 30-34
3.6/ 100
METRIC RATING
223rd/ 347
METRIC RANK
83.4%
IN LABOR FORCE | AGE 30-34
0.0/ 100
METRIC RATING
279th/ 347
METRIC RANK
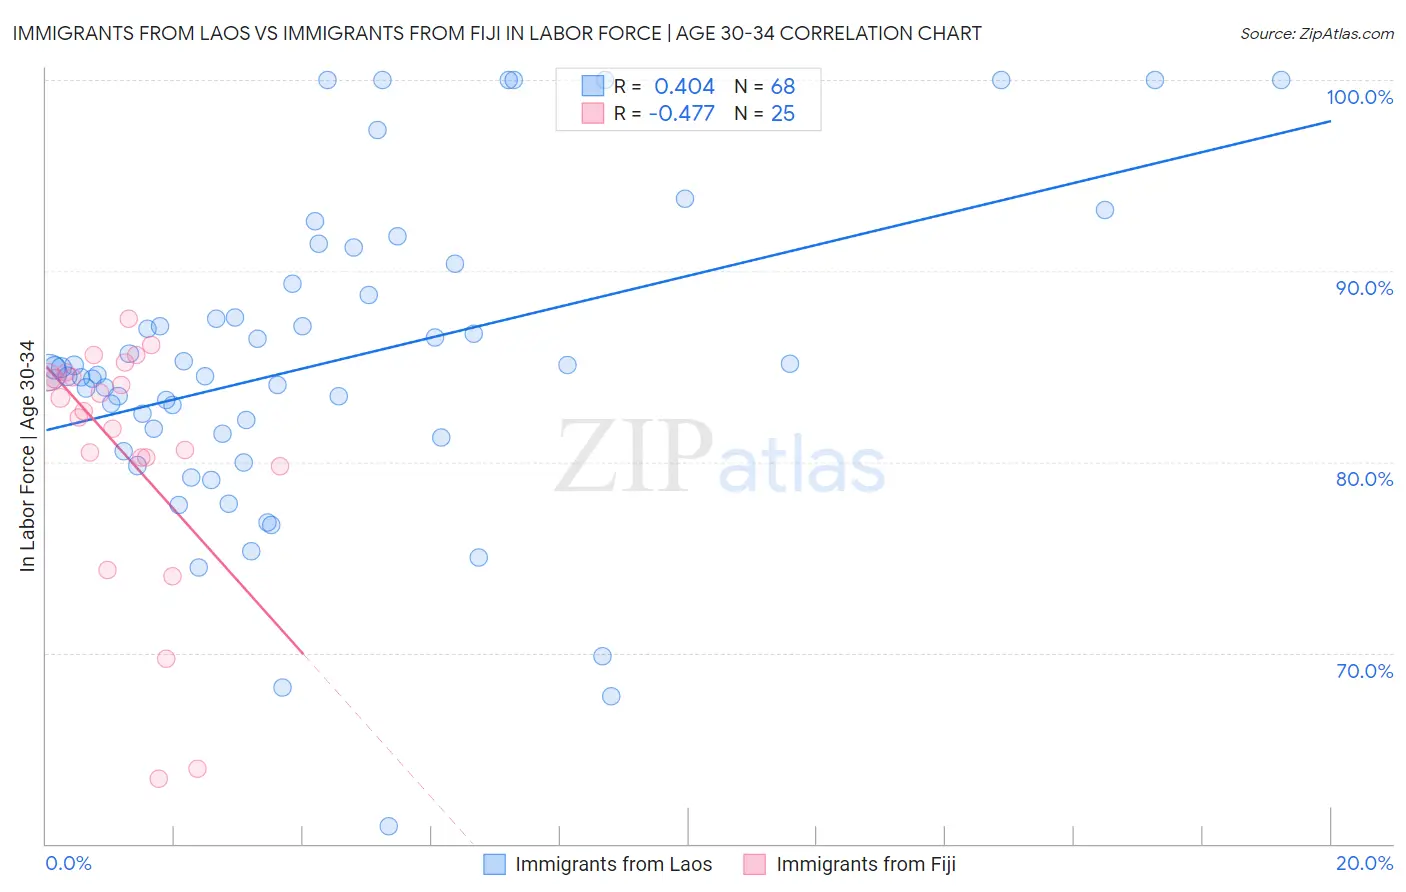
Immigrants from Laos vs Immigrants from Fiji In Labor Force | Age 30-34 Correlation Chart
The statistical analysis conducted on geographies consisting of 201,465,592 people shows a moderate positive correlation between the proportion of Immigrants from Laos and labor force participation rate among population between the ages 30 and 34 in the United States with a correlation coefficient (R) of 0.404 and weighted average of 84.2%. Similarly, the statistical analysis conducted on geographies consisting of 93,755,407 people shows a moderate negative correlation between the proportion of Immigrants from Fiji and labor force participation rate among population between the ages 30 and 34 in the United States with a correlation coefficient (R) of -0.477 and weighted average of 83.4%, a difference of 0.95%.
In Labor Force | Age 30-34 Correlation Summary
| Measurement | Immigrants from Laos | Immigrants from Fiji |
| Minimum | 60.9% | 63.4% |
| Maximum | 100.0% | 87.5% |
| Range | 39.1% | 24.1% |
| Mean | 85.2% | 80.5% |
| Median | 84.6% | 82.7% |
| Interquartile 25% (IQ1) | 81.4% | 80.0% |
| Interquartile 75% (IQ3) | 89.0% | 84.6% |
| Interquartile Range (IQR) | 7.6% | 4.6% |
| Standard Deviation (Sample) | 8.2% | 6.5% |
| Standard Deviation (Population) | 8.2% | 6.4% |
Similar Demographics by In Labor Force | Age 30-34
Demographics Similar to Immigrants from Laos by In Labor Force | Age 30-34
In terms of in labor force | age 30-34, the demographic groups most similar to Immigrants from Laos are Salvadoran (84.2%, a difference of 0.010%), Panamanian (84.2%, a difference of 0.010%), Cuban (84.2%, a difference of 0.010%), Scottish (84.2%, a difference of 0.030%), and Immigrants from El Salvador (84.2%, a difference of 0.030%).
| Demographics | Rating | Rank | In Labor Force | Age 30-34 |
| Immigrants | Ecuador | 7.1 /100 | #216 | Tragic 84.3% |
| Immigrants | Trinidad and Tobago | 7.0 /100 | #217 | Tragic 84.3% |
| Immigrants | Panama | 6.3 /100 | #218 | Tragic 84.3% |
| Swiss | 5.8 /100 | #219 | Tragic 84.3% |
| Danes | 5.3 /100 | #220 | Tragic 84.3% |
| Salvadorans | 3.8 /100 | #221 | Tragic 84.2% |
| Panamanians | 3.8 /100 | #222 | Tragic 84.2% |
| Immigrants | Laos | 3.6 /100 | #223 | Tragic 84.2% |
| Cubans | 3.4 /100 | #224 | Tragic 84.2% |
| Scottish | 3.1 /100 | #225 | Tragic 84.2% |
| Immigrants | El Salvador | 3.0 /100 | #226 | Tragic 84.2% |
| Immigrants | Cuba | 3.0 /100 | #227 | Tragic 84.2% |
| Immigrants | Haiti | 2.8 /100 | #228 | Tragic 84.2% |
| Welsh | 2.7 /100 | #229 | Tragic 84.2% |
| Immigrants | Bahamas | 2.6 /100 | #230 | Tragic 84.1% |
Demographics Similar to Immigrants from Fiji by In Labor Force | Age 30-34
In terms of in labor force | age 30-34, the demographic groups most similar to Immigrants from Fiji are Fijian (83.4%, a difference of 0.010%), African (83.4%, a difference of 0.030%), Delaware (83.5%, a difference of 0.070%), Tongan (83.5%, a difference of 0.080%), and Immigrants from Grenada (83.5%, a difference of 0.090%).
| Demographics | Rating | Rank | In Labor Force | Age 30-34 |
| Immigrants | Nonimmigrants | 0.0 /100 | #272 | Tragic 83.5% |
| Guamanians/Chamorros | 0.0 /100 | #273 | Tragic 83.5% |
| Belizeans | 0.0 /100 | #274 | Tragic 83.5% |
| Immigrants | Grenada | 0.0 /100 | #275 | Tragic 83.5% |
| Tongans | 0.0 /100 | #276 | Tragic 83.5% |
| Delaware | 0.0 /100 | #277 | Tragic 83.5% |
| Fijians | 0.0 /100 | #278 | Tragic 83.4% |
| Immigrants | Fiji | 0.0 /100 | #279 | Tragic 83.4% |
| Africans | 0.0 /100 | #280 | Tragic 83.4% |
| Samoans | 0.0 /100 | #281 | Tragic 83.3% |
| Mexican American Indians | 0.0 /100 | #282 | Tragic 83.2% |
| Assyrians/Chaldeans/Syriacs | 0.0 /100 | #283 | Tragic 83.2% |
| Immigrants | Belize | 0.0 /100 | #284 | Tragic 83.2% |
| Cree | 0.0 /100 | #285 | Tragic 83.2% |
| Immigrants | Latin America | 0.0 /100 | #286 | Tragic 83.1% |