Immigrants from Laos vs Immigrants from North Macedonia In Labor Force | Age 30-34
COMPARE
Immigrants from Laos
Immigrants from North Macedonia
In Labor Force | Age 30-34
In Labor Force | Age 30-34 Comparison
Immigrants from Laos
Immigrants from North Macedonia
84.2%
IN LABOR FORCE | AGE 30-34
3.6/ 100
METRIC RATING
223rd/ 347
METRIC RANK
85.9%
IN LABOR FORCE | AGE 30-34
100.0/ 100
METRIC RATING
25th/ 347
METRIC RANK
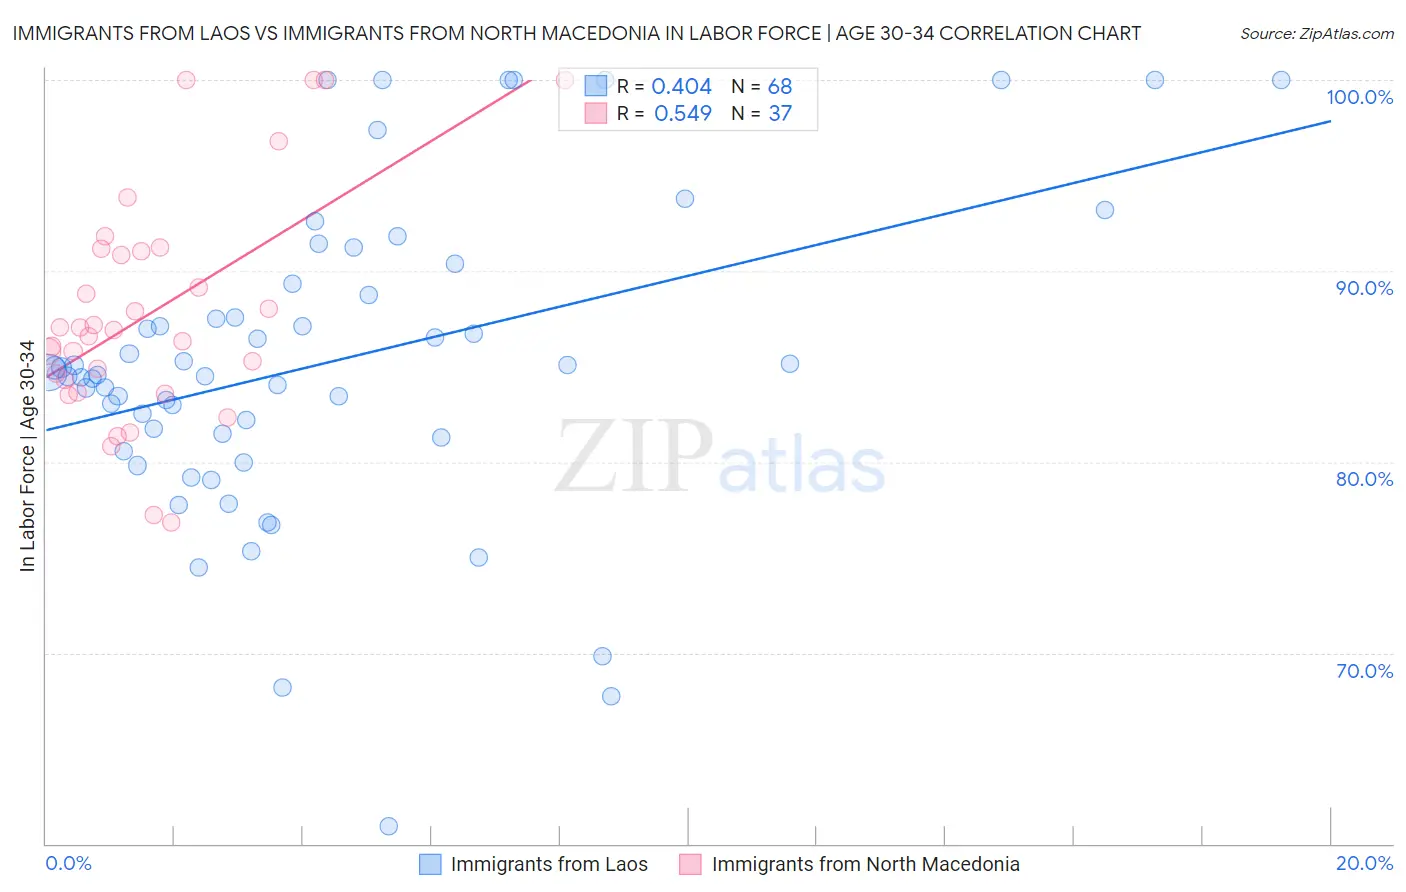
Immigrants from Laos vs Immigrants from North Macedonia In Labor Force | Age 30-34 Correlation Chart
The statistical analysis conducted on geographies consisting of 201,465,592 people shows a moderate positive correlation between the proportion of Immigrants from Laos and labor force participation rate among population between the ages 30 and 34 in the United States with a correlation coefficient (R) of 0.404 and weighted average of 84.2%. Similarly, the statistical analysis conducted on geographies consisting of 74,312,807 people shows a substantial positive correlation between the proportion of Immigrants from North Macedonia and labor force participation rate among population between the ages 30 and 34 in the United States with a correlation coefficient (R) of 0.549 and weighted average of 85.9%, a difference of 2.1%.
In Labor Force | Age 30-34 Correlation Summary
| Measurement | Immigrants from Laos | Immigrants from North Macedonia |
| Minimum | 60.9% | 76.8% |
| Maximum | 100.0% | 100.0% |
| Range | 39.1% | 23.2% |
| Mean | 85.2% | 87.8% |
| Median | 84.6% | 86.9% |
| Interquartile 25% (IQ1) | 81.4% | 83.9% |
| Interquartile 75% (IQ3) | 89.0% | 91.1% |
| Interquartile Range (IQR) | 7.6% | 7.2% |
| Standard Deviation (Sample) | 8.2% | 6.0% |
| Standard Deviation (Population) | 8.2% | 5.9% |
Similar Demographics by In Labor Force | Age 30-34
Demographics Similar to Immigrants from Laos by In Labor Force | Age 30-34
In terms of in labor force | age 30-34, the demographic groups most similar to Immigrants from Laos are Salvadoran (84.2%, a difference of 0.010%), Panamanian (84.2%, a difference of 0.010%), Cuban (84.2%, a difference of 0.010%), Scottish (84.2%, a difference of 0.030%), and Immigrants from El Salvador (84.2%, a difference of 0.030%).
| Demographics | Rating | Rank | In Labor Force | Age 30-34 |
| Immigrants | Ecuador | 7.1 /100 | #216 | Tragic 84.3% |
| Immigrants | Trinidad and Tobago | 7.0 /100 | #217 | Tragic 84.3% |
| Immigrants | Panama | 6.3 /100 | #218 | Tragic 84.3% |
| Swiss | 5.8 /100 | #219 | Tragic 84.3% |
| Danes | 5.3 /100 | #220 | Tragic 84.3% |
| Salvadorans | 3.8 /100 | #221 | Tragic 84.2% |
| Panamanians | 3.8 /100 | #222 | Tragic 84.2% |
| Immigrants | Laos | 3.6 /100 | #223 | Tragic 84.2% |
| Cubans | 3.4 /100 | #224 | Tragic 84.2% |
| Scottish | 3.1 /100 | #225 | Tragic 84.2% |
| Immigrants | El Salvador | 3.0 /100 | #226 | Tragic 84.2% |
| Immigrants | Cuba | 3.0 /100 | #227 | Tragic 84.2% |
| Immigrants | Haiti | 2.8 /100 | #228 | Tragic 84.2% |
| Welsh | 2.7 /100 | #229 | Tragic 84.2% |
| Immigrants | Bahamas | 2.6 /100 | #230 | Tragic 84.1% |
Demographics Similar to Immigrants from North Macedonia by In Labor Force | Age 30-34
In terms of in labor force | age 30-34, the demographic groups most similar to Immigrants from North Macedonia are Immigrants from Eritrea (85.9%, a difference of 0.010%), Immigrants from Eastern Africa (85.9%, a difference of 0.010%), Bermudan (85.9%, a difference of 0.020%), Estonian (85.9%, a difference of 0.020%), and Immigrants from Liberia (85.9%, a difference of 0.030%).
| Demographics | Rating | Rank | In Labor Force | Age 30-34 |
| Immigrants | Sierra Leone | 100.0 /100 | #18 | Exceptional 86.0% |
| Sierra Leoneans | 100.0 /100 | #19 | Exceptional 86.0% |
| Bulgarians | 100.0 /100 | #20 | Exceptional 86.0% |
| Immigrants | Bulgaria | 100.0 /100 | #21 | Exceptional 86.0% |
| Bermudans | 100.0 /100 | #22 | Exceptional 85.9% |
| Estonians | 100.0 /100 | #23 | Exceptional 85.9% |
| Immigrants | Eritrea | 100.0 /100 | #24 | Exceptional 85.9% |
| Immigrants | North Macedonia | 100.0 /100 | #25 | Exceptional 85.9% |
| Immigrants | Eastern Africa | 100.0 /100 | #26 | Exceptional 85.9% |
| Immigrants | Liberia | 100.0 /100 | #27 | Exceptional 85.9% |
| Immigrants | Latvia | 100.0 /100 | #28 | Exceptional 85.9% |
| Tsimshian | 100.0 /100 | #29 | Exceptional 85.8% |
| Immigrants | Hong Kong | 100.0 /100 | #30 | Exceptional 85.8% |
| Paraguayans | 99.9 /100 | #31 | Exceptional 85.8% |
| Cypriots | 99.9 /100 | #32 | Exceptional 85.8% |