Immigrants from Laos vs Liberian In Labor Force | Age 30-34
COMPARE
Immigrants from Laos
Liberian
In Labor Force | Age 30-34
In Labor Force | Age 30-34 Comparison
Immigrants from Laos
Liberians
84.2%
IN LABOR FORCE | AGE 30-34
3.6/ 100
METRIC RATING
223rd/ 347
METRIC RANK
86.4%
IN LABOR FORCE | AGE 30-34
100.0/ 100
METRIC RATING
4th/ 347
METRIC RANK
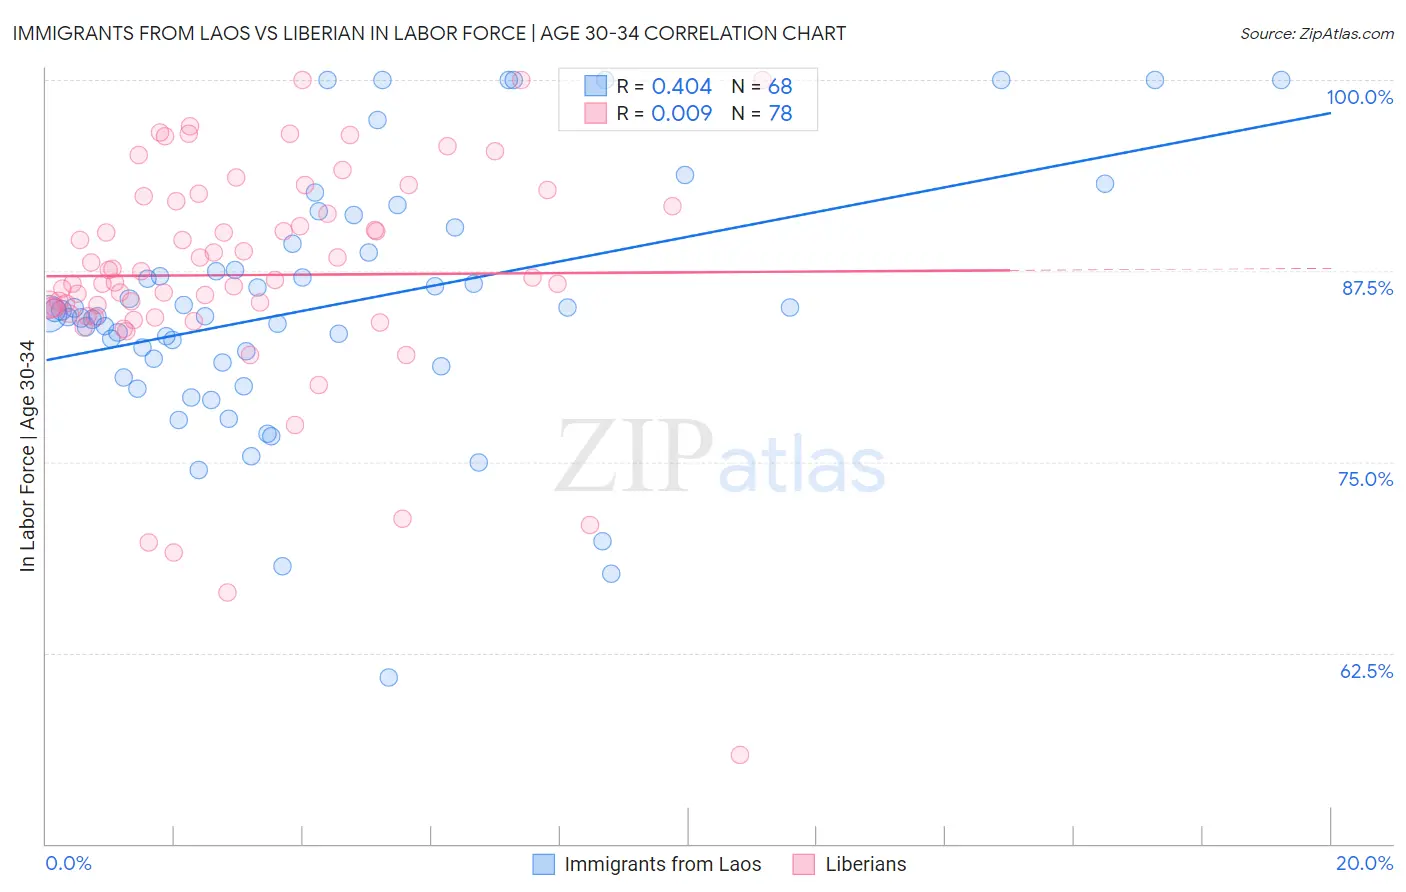
Immigrants from Laos vs Liberian In Labor Force | Age 30-34 Correlation Chart
The statistical analysis conducted on geographies consisting of 201,465,592 people shows a moderate positive correlation between the proportion of Immigrants from Laos and labor force participation rate among population between the ages 30 and 34 in the United States with a correlation coefficient (R) of 0.404 and weighted average of 84.2%. Similarly, the statistical analysis conducted on geographies consisting of 118,050,692 people shows no correlation between the proportion of Liberians and labor force participation rate among population between the ages 30 and 34 in the United States with a correlation coefficient (R) of 0.009 and weighted average of 86.4%, a difference of 2.6%.
In Labor Force | Age 30-34 Correlation Summary
| Measurement | Immigrants from Laos | Liberian |
| Minimum | 60.9% | 55.8% |
| Maximum | 100.0% | 100.0% |
| Range | 39.1% | 44.2% |
| Mean | 85.2% | 87.2% |
| Median | 84.6% | 87.0% |
| Interquartile 25% (IQ1) | 81.4% | 84.7% |
| Interquartile 75% (IQ3) | 89.0% | 92.1% |
| Interquartile Range (IQR) | 7.6% | 7.4% |
| Standard Deviation (Sample) | 8.2% | 7.6% |
| Standard Deviation (Population) | 8.2% | 7.6% |
Similar Demographics by In Labor Force | Age 30-34
Demographics Similar to Immigrants from Laos by In Labor Force | Age 30-34
In terms of in labor force | age 30-34, the demographic groups most similar to Immigrants from Laos are Salvadoran (84.2%, a difference of 0.010%), Panamanian (84.2%, a difference of 0.010%), Cuban (84.2%, a difference of 0.010%), Scottish (84.2%, a difference of 0.030%), and Immigrants from El Salvador (84.2%, a difference of 0.030%).
| Demographics | Rating | Rank | In Labor Force | Age 30-34 |
| Immigrants | Ecuador | 7.1 /100 | #216 | Tragic 84.3% |
| Immigrants | Trinidad and Tobago | 7.0 /100 | #217 | Tragic 84.3% |
| Immigrants | Panama | 6.3 /100 | #218 | Tragic 84.3% |
| Swiss | 5.8 /100 | #219 | Tragic 84.3% |
| Danes | 5.3 /100 | #220 | Tragic 84.3% |
| Salvadorans | 3.8 /100 | #221 | Tragic 84.2% |
| Panamanians | 3.8 /100 | #222 | Tragic 84.2% |
| Immigrants | Laos | 3.6 /100 | #223 | Tragic 84.2% |
| Cubans | 3.4 /100 | #224 | Tragic 84.2% |
| Scottish | 3.1 /100 | #225 | Tragic 84.2% |
| Immigrants | El Salvador | 3.0 /100 | #226 | Tragic 84.2% |
| Immigrants | Cuba | 3.0 /100 | #227 | Tragic 84.2% |
| Immigrants | Haiti | 2.8 /100 | #228 | Tragic 84.2% |
| Welsh | 2.7 /100 | #229 | Tragic 84.2% |
| Immigrants | Bahamas | 2.6 /100 | #230 | Tragic 84.1% |
Demographics Similar to Liberians by In Labor Force | Age 30-34
In terms of in labor force | age 30-34, the demographic groups most similar to Liberians are Immigrants from Ireland (86.3%, a difference of 0.14%), Somali (86.2%, a difference of 0.17%), Immigrants from Ethiopia (86.6%, a difference of 0.19%), Immigrants from Bolivia (86.2%, a difference of 0.19%), and Ethiopian (86.6%, a difference of 0.20%).
| Demographics | Rating | Rank | In Labor Force | Age 30-34 |
| Luxembourgers | 100.0 /100 | #1 | Exceptional 86.6% |
| Ethiopians | 100.0 /100 | #2 | Exceptional 86.6% |
| Immigrants | Ethiopia | 100.0 /100 | #3 | Exceptional 86.6% |
| Liberians | 100.0 /100 | #4 | Exceptional 86.4% |
| Immigrants | Ireland | 100.0 /100 | #5 | Exceptional 86.3% |
| Somalis | 100.0 /100 | #6 | Exceptional 86.2% |
| Immigrants | Bolivia | 100.0 /100 | #7 | Exceptional 86.2% |
| Cambodians | 100.0 /100 | #8 | Exceptional 86.2% |
| Immigrants | Somalia | 100.0 /100 | #9 | Exceptional 86.2% |
| Immigrants | Serbia | 100.0 /100 | #10 | Exceptional 86.2% |
| Carpatho Rusyns | 100.0 /100 | #11 | Exceptional 86.2% |
| Bolivians | 100.0 /100 | #12 | Exceptional 86.1% |
| Immigrants | Croatia | 100.0 /100 | #13 | Exceptional 86.1% |
| Immigrants | Cabo Verde | 100.0 /100 | #14 | Exceptional 86.1% |
| Immigrants | Albania | 100.0 /100 | #15 | Exceptional 86.1% |