Immigrants from Kenya vs Hawaiian In Labor Force | Age > 16
COMPARE
Immigrants from Kenya
Hawaiian
In Labor Force | Age > 16
In Labor Force | Age > 16 Comparison
Immigrants from Kenya
Hawaiians
67.6%
IN LABOR FORCE | AGE > 16
100.0/ 100
METRIC RATING
20th/ 347
METRIC RANK
64.7%
IN LABOR FORCE | AGE > 16
9.3/ 100
METRIC RATING
222nd/ 347
METRIC RANK
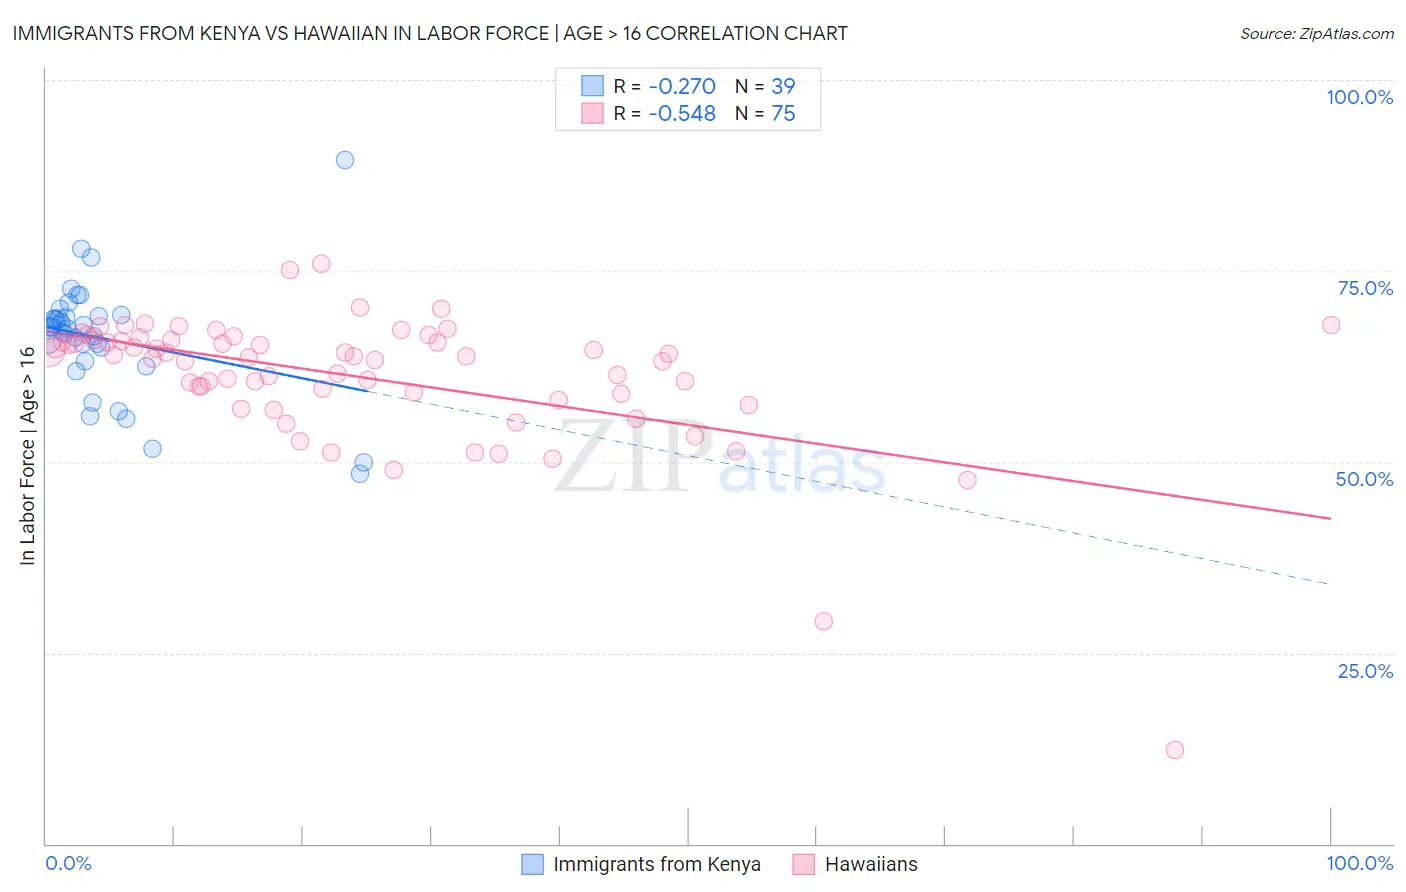
Immigrants from Kenya vs Hawaiian In Labor Force | Age > 16 Correlation Chart
The statistical analysis conducted on geographies consisting of 218,088,200 people shows a weak negative correlation between the proportion of Immigrants from Kenya and labor force participation rate among population ages 16 and over in the United States with a correlation coefficient (R) of -0.270 and weighted average of 67.6%. Similarly, the statistical analysis conducted on geographies consisting of 327,602,725 people shows a substantial negative correlation between the proportion of Hawaiians and labor force participation rate among population ages 16 and over in the United States with a correlation coefficient (R) of -0.548 and weighted average of 64.7%, a difference of 4.4%.
In Labor Force | Age > 16 Correlation Summary
| Measurement | Immigrants from Kenya | Hawaiian |
| Minimum | 48.4% | 12.2% |
| Maximum | 89.6% | 76.0% |
| Range | 41.2% | 63.8% |
| Mean | 66.2% | 61.2% |
| Median | 67.4% | 63.8% |
| Interquartile 25% (IQ1) | 63.2% | 59.0% |
| Interquartile 75% (IQ3) | 69.0% | 65.9% |
| Interquartile Range (IQR) | 5.8% | 6.9% |
| Standard Deviation (Sample) | 7.6% | 9.0% |
| Standard Deviation (Population) | 7.5% | 8.9% |
Similar Demographics by In Labor Force | Age > 16
Demographics Similar to Immigrants from Kenya by In Labor Force | Age > 16
In terms of in labor force | age > 16, the demographic groups most similar to Immigrants from Kenya are Tongan (67.5%, a difference of 0.020%), Kenyan (67.6%, a difference of 0.050%), Immigrants from Uganda (67.5%, a difference of 0.080%), Immigrants from Liberia (67.6%, a difference of 0.090%), and Immigrants from India (67.6%, a difference of 0.10%).
| Demographics | Rating | Rank | In Labor Force | Age > 16 |
| Immigrants | Nepal | 100.0 /100 | #13 | Exceptional 68.0% |
| Liberians | 100.0 /100 | #14 | Exceptional 67.8% |
| Immigrants | Middle Africa | 100.0 /100 | #15 | Exceptional 67.7% |
| Immigrants | Sudan | 100.0 /100 | #16 | Exceptional 67.7% |
| Immigrants | India | 100.0 /100 | #17 | Exceptional 67.6% |
| Immigrants | Liberia | 100.0 /100 | #18 | Exceptional 67.6% |
| Kenyans | 100.0 /100 | #19 | Exceptional 67.6% |
| Immigrants | Kenya | 100.0 /100 | #20 | Exceptional 67.6% |
| Tongans | 100.0 /100 | #21 | Exceptional 67.5% |
| Immigrants | Uganda | 100.0 /100 | #22 | Exceptional 67.5% |
| Cambodians | 100.0 /100 | #23 | Exceptional 67.4% |
| Ugandans | 100.0 /100 | #24 | Exceptional 67.4% |
| Immigrants | Africa | 100.0 /100 | #25 | Exceptional 67.4% |
| Immigrants | Cabo Verde | 100.0 /100 | #26 | Exceptional 67.3% |
| Zimbabweans | 100.0 /100 | #27 | Exceptional 67.3% |
Demographics Similar to Hawaiians by In Labor Force | Age > 16
In terms of in labor force | age > 16, the demographic groups most similar to Hawaiians are Immigrants from Belize (64.7%, a difference of 0.0%), Immigrants from Micronesia (64.7%, a difference of 0.010%), Alaska Native (64.7%, a difference of 0.020%), Immigrants from Jamaica (64.7%, a difference of 0.020%), and Croatian (64.7%, a difference of 0.020%).
| Demographics | Rating | Rank | In Labor Force | Age > 16 |
| Immigrants | Czechoslovakia | 12.3 /100 | #215 | Poor 64.8% |
| Belgians | 11.4 /100 | #216 | Poor 64.7% |
| U.S. Virgin Islanders | 11.3 /100 | #217 | Poor 64.7% |
| Alsatians | 10.7 /100 | #218 | Poor 64.7% |
| Immigrants | Central America | 10.5 /100 | #219 | Poor 64.7% |
| Alaska Natives | 9.9 /100 | #220 | Tragic 64.7% |
| Immigrants | Micronesia | 9.6 /100 | #221 | Tragic 64.7% |
| Hawaiians | 9.3 /100 | #222 | Tragic 64.7% |
| Immigrants | Belize | 9.2 /100 | #223 | Tragic 64.7% |
| Immigrants | Jamaica | 8.8 /100 | #224 | Tragic 64.7% |
| Croatians | 8.8 /100 | #225 | Tragic 64.7% |
| Europeans | 8.3 /100 | #226 | Tragic 64.7% |
| Poles | 8.3 /100 | #227 | Tragic 64.7% |
| Northern Europeans | 8.2 /100 | #228 | Tragic 64.7% |
| British | 7.3 /100 | #229 | Tragic 64.7% |