Croatian vs Hawaiian In Labor Force | Age > 16
COMPARE
Croatian
Hawaiian
In Labor Force | Age > 16
In Labor Force | Age > 16 Comparison
Croatians
Hawaiians
64.7%
IN LABOR FORCE | AGE > 16
8.8/ 100
METRIC RATING
225th/ 347
METRIC RANK
64.7%
IN LABOR FORCE | AGE > 16
9.3/ 100
METRIC RATING
222nd/ 347
METRIC RANK
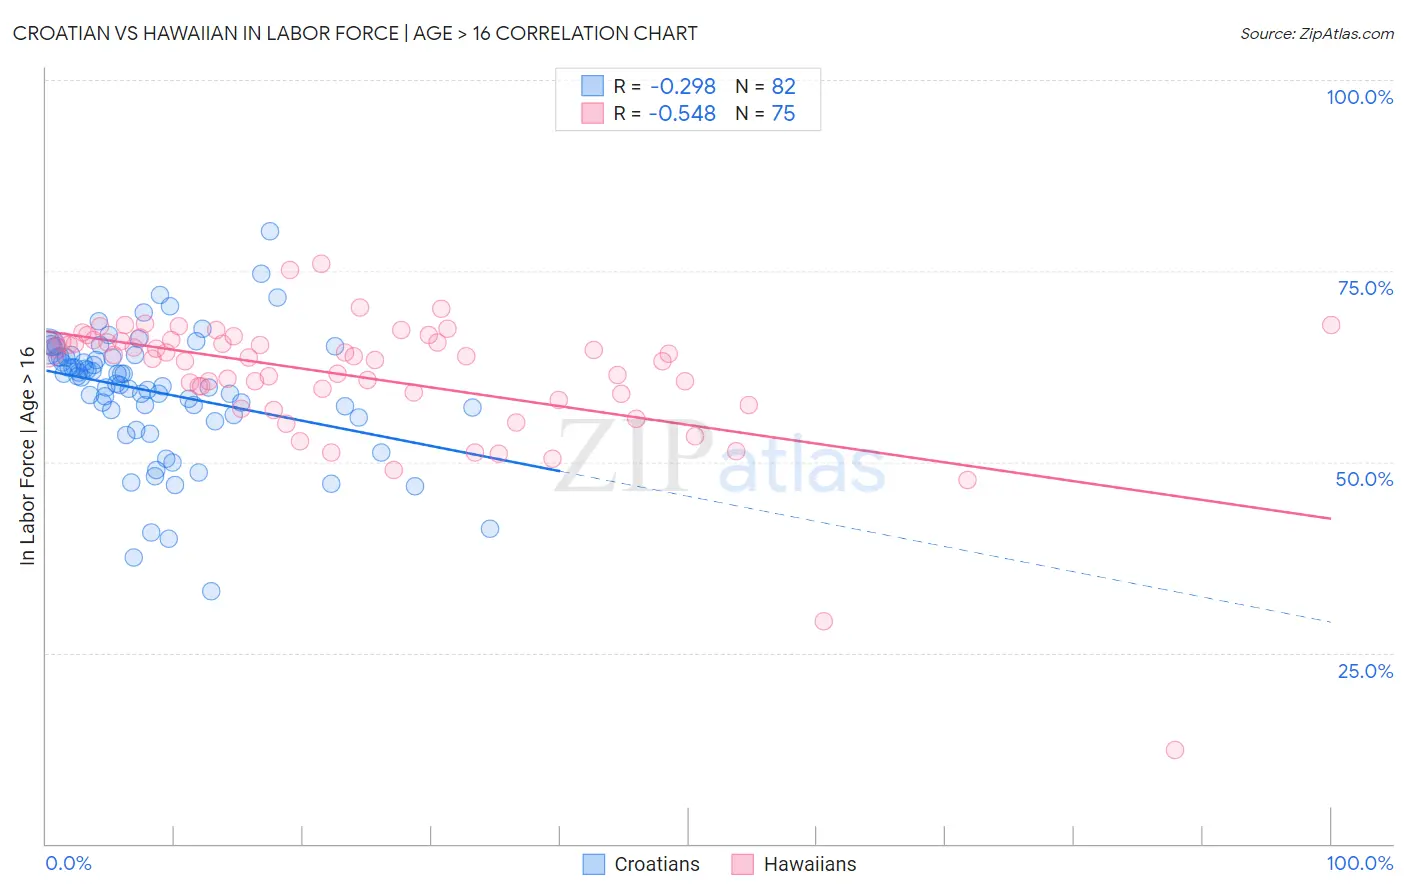
Croatian vs Hawaiian In Labor Force | Age > 16 Correlation Chart
The statistical analysis conducted on geographies consisting of 375,747,004 people shows a weak negative correlation between the proportion of Croatians and labor force participation rate among population ages 16 and over in the United States with a correlation coefficient (R) of -0.298 and weighted average of 64.7%. Similarly, the statistical analysis conducted on geographies consisting of 327,602,725 people shows a substantial negative correlation between the proportion of Hawaiians and labor force participation rate among population ages 16 and over in the United States with a correlation coefficient (R) of -0.548 and weighted average of 64.7%, a difference of 0.020%.
In Labor Force | Age > 16 Correlation Summary
| Measurement | Croatian | Hawaiian |
| Minimum | 33.0% | 12.2% |
| Maximum | 80.2% | 76.0% |
| Range | 47.2% | 63.8% |
| Mean | 59.1% | 61.2% |
| Median | 60.6% | 63.8% |
| Interquartile 25% (IQ1) | 56.1% | 59.0% |
| Interquartile 75% (IQ3) | 63.8% | 65.9% |
| Interquartile Range (IQR) | 7.7% | 6.9% |
| Standard Deviation (Sample) | 8.3% | 9.0% |
| Standard Deviation (Population) | 8.2% | 8.9% |
Demographics Similar to Croatians and Hawaiians by In Labor Force | Age > 16
In terms of in labor force | age > 16, the demographic groups most similar to Croatians are Immigrants from Jamaica (64.7%, a difference of 0.0%), Immigrants from Belize (64.7%, a difference of 0.010%), European (64.7%, a difference of 0.020%), Polish (64.7%, a difference of 0.020%), and Northern European (64.7%, a difference of 0.020%). Similarly, the demographic groups most similar to Hawaiians are Immigrants from Belize (64.7%, a difference of 0.0%), Immigrants from Micronesia (64.7%, a difference of 0.010%), Alaska Native (64.7%, a difference of 0.020%), Immigrants from Jamaica (64.7%, a difference of 0.020%), and Alsatian (64.7%, a difference of 0.040%).
| Demographics | Rating | Rank | In Labor Force | Age > 16 |
| Maltese | 13.8 /100 | #213 | Poor 64.8% |
| Estonians | 13.1 /100 | #214 | Poor 64.8% |
| Immigrants | Czechoslovakia | 12.3 /100 | #215 | Poor 64.8% |
| Belgians | 11.4 /100 | #216 | Poor 64.7% |
| U.S. Virgin Islanders | 11.3 /100 | #217 | Poor 64.7% |
| Alsatians | 10.7 /100 | #218 | Poor 64.7% |
| Immigrants | Central America | 10.5 /100 | #219 | Poor 64.7% |
| Alaska Natives | 9.9 /100 | #220 | Tragic 64.7% |
| Immigrants | Micronesia | 9.6 /100 | #221 | Tragic 64.7% |
| Hawaiians | 9.3 /100 | #222 | Tragic 64.7% |
| Immigrants | Belize | 9.2 /100 | #223 | Tragic 64.7% |
| Immigrants | Jamaica | 8.8 /100 | #224 | Tragic 64.7% |
| Croatians | 8.8 /100 | #225 | Tragic 64.7% |
| Europeans | 8.3 /100 | #226 | Tragic 64.7% |
| Poles | 8.3 /100 | #227 | Tragic 64.7% |
| Northern Europeans | 8.2 /100 | #228 | Tragic 64.7% |
| British | 7.3 /100 | #229 | Tragic 64.7% |
| Chinese | 7.3 /100 | #230 | Tragic 64.7% |
| Immigrants | Northern Europe | 7.2 /100 | #231 | Tragic 64.7% |
| Africans | 5.8 /100 | #232 | Tragic 64.6% |
| Slavs | 4.9 /100 | #233 | Tragic 64.6% |