Immigrants from Kenya vs Yugoslavian In Labor Force | Age > 16
COMPARE
Immigrants from Kenya
Yugoslavian
In Labor Force | Age > 16
In Labor Force | Age > 16 Comparison
Immigrants from Kenya
Yugoslavians
67.6%
IN LABOR FORCE | AGE > 16
100.0/ 100
METRIC RATING
20th/ 347
METRIC RANK
65.4%
IN LABOR FORCE | AGE > 16
81.3/ 100
METRIC RATING
152nd/ 347
METRIC RANK
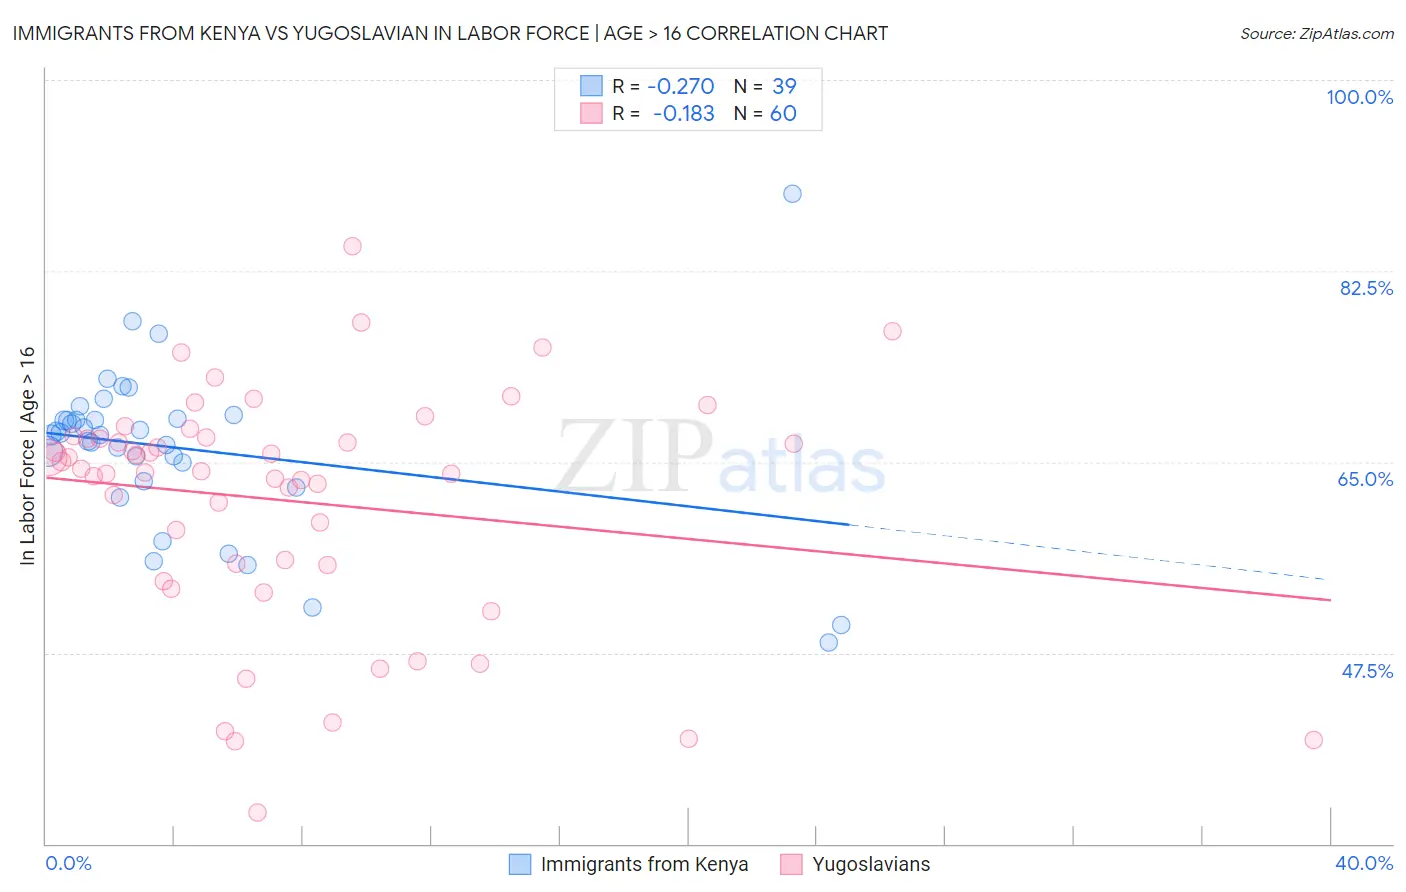
Immigrants from Kenya vs Yugoslavian In Labor Force | Age > 16 Correlation Chart
The statistical analysis conducted on geographies consisting of 218,088,200 people shows a weak negative correlation between the proportion of Immigrants from Kenya and labor force participation rate among population ages 16 and over in the United States with a correlation coefficient (R) of -0.270 and weighted average of 67.6%. Similarly, the statistical analysis conducted on geographies consisting of 285,722,501 people shows a poor negative correlation between the proportion of Yugoslavians and labor force participation rate among population ages 16 and over in the United States with a correlation coefficient (R) of -0.183 and weighted average of 65.4%, a difference of 3.3%.
In Labor Force | Age > 16 Correlation Summary
| Measurement | Immigrants from Kenya | Yugoslavian |
| Minimum | 48.4% | 32.9% |
| Maximum | 89.6% | 84.8% |
| Range | 41.2% | 51.9% |
| Mean | 66.2% | 61.4% |
| Median | 67.4% | 64.3% |
| Interquartile 25% (IQ1) | 63.2% | 55.6% |
| Interquartile 75% (IQ3) | 69.0% | 67.2% |
| Interquartile Range (IQR) | 5.8% | 11.6% |
| Standard Deviation (Sample) | 7.6% | 10.9% |
| Standard Deviation (Population) | 7.5% | 10.8% |
Similar Demographics by In Labor Force | Age > 16
Demographics Similar to Immigrants from Kenya by In Labor Force | Age > 16
In terms of in labor force | age > 16, the demographic groups most similar to Immigrants from Kenya are Tongan (67.5%, a difference of 0.020%), Kenyan (67.6%, a difference of 0.050%), Immigrants from Uganda (67.5%, a difference of 0.080%), Immigrants from Liberia (67.6%, a difference of 0.090%), and Immigrants from India (67.6%, a difference of 0.10%).
| Demographics | Rating | Rank | In Labor Force | Age > 16 |
| Immigrants | Nepal | 100.0 /100 | #13 | Exceptional 68.0% |
| Liberians | 100.0 /100 | #14 | Exceptional 67.8% |
| Immigrants | Middle Africa | 100.0 /100 | #15 | Exceptional 67.7% |
| Immigrants | Sudan | 100.0 /100 | #16 | Exceptional 67.7% |
| Immigrants | India | 100.0 /100 | #17 | Exceptional 67.6% |
| Immigrants | Liberia | 100.0 /100 | #18 | Exceptional 67.6% |
| Kenyans | 100.0 /100 | #19 | Exceptional 67.6% |
| Immigrants | Kenya | 100.0 /100 | #20 | Exceptional 67.6% |
| Tongans | 100.0 /100 | #21 | Exceptional 67.5% |
| Immigrants | Uganda | 100.0 /100 | #22 | Exceptional 67.5% |
| Cambodians | 100.0 /100 | #23 | Exceptional 67.4% |
| Ugandans | 100.0 /100 | #24 | Exceptional 67.4% |
| Immigrants | Africa | 100.0 /100 | #25 | Exceptional 67.4% |
| Immigrants | Cabo Verde | 100.0 /100 | #26 | Exceptional 67.3% |
| Zimbabweans | 100.0 /100 | #27 | Exceptional 67.3% |
Demographics Similar to Yugoslavians by In Labor Force | Age > 16
In terms of in labor force | age > 16, the demographic groups most similar to Yugoslavians are Czech (65.4%, a difference of 0.0%), Immigrants (65.4%, a difference of 0.010%), Immigrants from China (65.4%, a difference of 0.010%), Immigrants from Eastern Europe (65.4%, a difference of 0.050%), and Immigrants from Armenia (65.3%, a difference of 0.080%).
| Demographics | Rating | Rank | In Labor Force | Age > 16 |
| Tlingit-Haida | 88.3 /100 | #145 | Excellent 65.5% |
| Cypriots | 88.2 /100 | #146 | Excellent 65.5% |
| Immigrants | Oceania | 87.5 /100 | #147 | Excellent 65.5% |
| Bhutanese | 86.3 /100 | #148 | Excellent 65.5% |
| Immigrants | Albania | 85.7 /100 | #149 | Excellent 65.4% |
| Immigrants | Immigrants | 81.9 /100 | #150 | Excellent 65.4% |
| Czechs | 81.5 /100 | #151 | Excellent 65.4% |
| Yugoslavians | 81.3 /100 | #152 | Excellent 65.4% |
| Immigrants | China | 80.5 /100 | #153 | Excellent 65.4% |
| Immigrants | Eastern Europe | 78.3 /100 | #154 | Good 65.4% |
| Immigrants | Armenia | 76.6 /100 | #155 | Good 65.3% |
| Immigrants | Ireland | 75.9 /100 | #156 | Good 65.3% |
| Immigrants | Russia | 75.7 /100 | #157 | Good 65.3% |
| Panamanians | 75.2 /100 | #158 | Good 65.3% |
| Immigrants | Syria | 74.6 /100 | #159 | Good 65.3% |