Immigrants from Kenya vs Hawaiian Bachelor's Degree
COMPARE
Immigrants from Kenya
Hawaiian
Bachelor's Degree
Bachelor's Degree Comparison
Immigrants from Kenya
Hawaiians
38.8%
BACHELOR'S DEGREE
73.8/ 100
METRIC RATING
155th/ 347
METRIC RANK
31.6%
BACHELOR'S DEGREE
0.1/ 100
METRIC RATING
279th/ 347
METRIC RANK
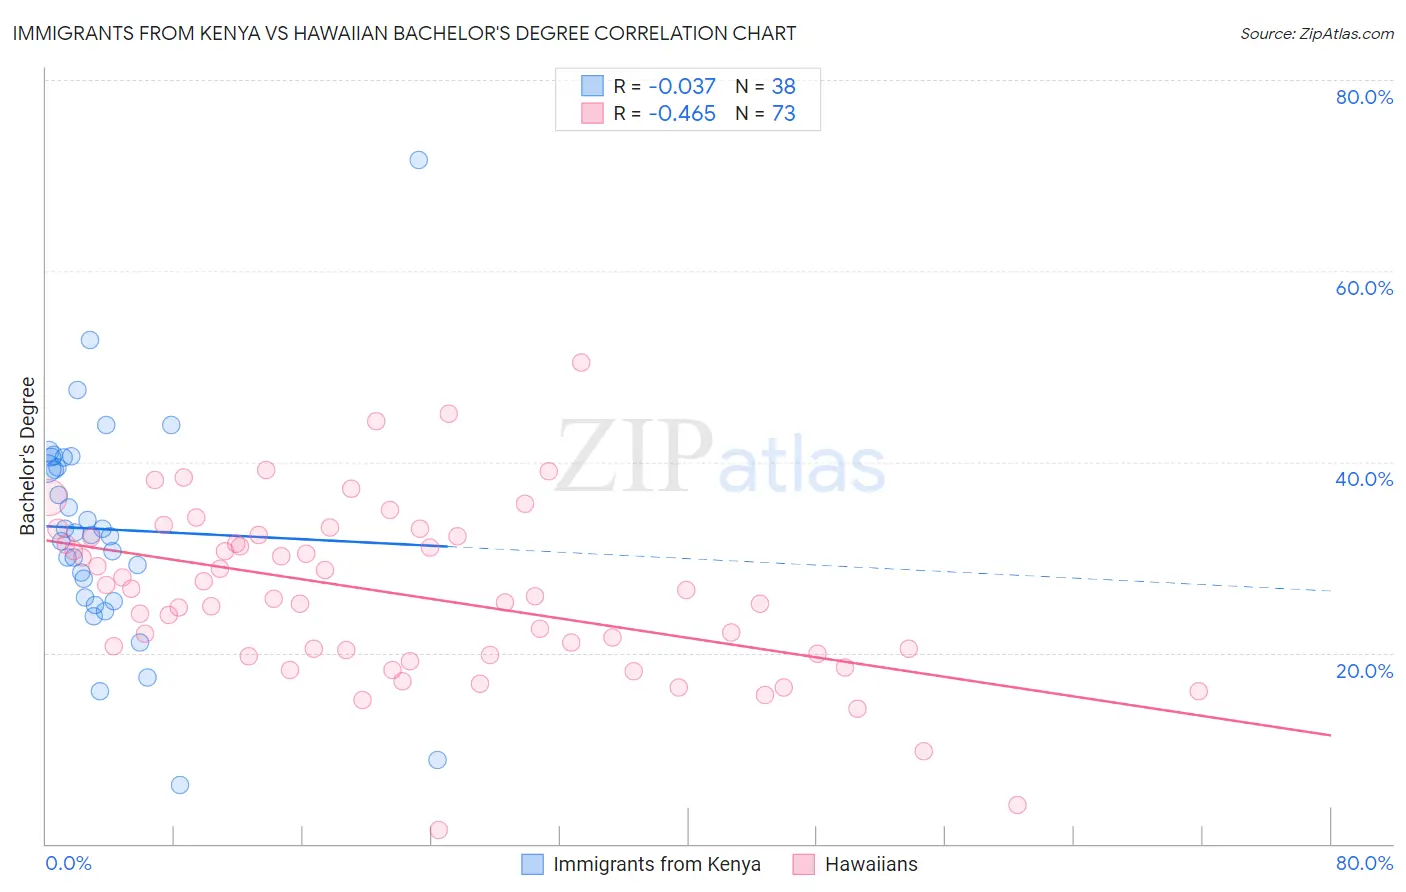
Immigrants from Kenya vs Hawaiian Bachelor's Degree Correlation Chart
The statistical analysis conducted on geographies consisting of 218,073,270 people shows no correlation between the proportion of Immigrants from Kenya and percentage of population with at least bachelor's degree education in the United States with a correlation coefficient (R) of -0.037 and weighted average of 38.8%. Similarly, the statistical analysis conducted on geographies consisting of 327,580,632 people shows a moderate negative correlation between the proportion of Hawaiians and percentage of population with at least bachelor's degree education in the United States with a correlation coefficient (R) of -0.465 and weighted average of 31.6%, a difference of 22.6%.
Bachelor's Degree Correlation Summary
| Measurement | Immigrants from Kenya | Hawaiian |
| Minimum | 6.2% | 1.4% |
| Maximum | 71.6% | 50.4% |
| Range | 65.4% | 49.0% |
| Mean | 32.9% | 26.2% |
| Median | 32.5% | 26.0% |
| Interquartile 25% (IQ1) | 25.8% | 19.8% |
| Interquartile 75% (IQ3) | 40.5% | 32.1% |
| Interquartile Range (IQR) | 14.7% | 12.3% |
| Standard Deviation (Sample) | 11.8% | 8.9% |
| Standard Deviation (Population) | 11.7% | 8.9% |
Similar Demographics by Bachelor's Degree
Demographics Similar to Immigrants from Kenya by Bachelor's Degree
In terms of bachelor's degree, the demographic groups most similar to Immigrants from Kenya are Canadian (38.8%, a difference of 0.15%), Kenyan (38.7%, a difference of 0.15%), Slavic (38.9%, a difference of 0.27%), Sudanese (38.9%, a difference of 0.33%), and Immigrants from Africa (38.9%, a difference of 0.35%).
| Demographics | Rating | Rank | Bachelor's Degree |
| Iraqis | 78.1 /100 | #148 | Good 39.0% |
| Immigrants | Poland | 77.5 /100 | #149 | Good 39.0% |
| South Americans | 77.3 /100 | #150 | Good 38.9% |
| Immigrants | Africa | 76.5 /100 | #151 | Good 38.9% |
| Sudanese | 76.4 /100 | #152 | Good 38.9% |
| Slavs | 75.9 /100 | #153 | Good 38.9% |
| Canadians | 75.0 /100 | #154 | Good 38.8% |
| Immigrants | Kenya | 73.8 /100 | #155 | Good 38.8% |
| Kenyans | 72.5 /100 | #156 | Good 38.7% |
| Immigrants | South America | 70.1 /100 | #157 | Good 38.6% |
| Immigrants | Germany | 69.6 /100 | #158 | Good 38.6% |
| Chinese | 66.6 /100 | #159 | Good 38.5% |
| Vietnamese | 66.6 /100 | #160 | Good 38.5% |
| Uruguayans | 65.8 /100 | #161 | Good 38.4% |
| Colombians | 65.0 /100 | #162 | Good 38.4% |
Demographics Similar to Hawaiians by Bachelor's Degree
In terms of bachelor's degree, the demographic groups most similar to Hawaiians are Immigrants from Laos (31.6%, a difference of 0.050%), Marshallese (31.7%, a difference of 0.35%), Dominican (31.8%, a difference of 0.40%), Blackfeet (31.5%, a difference of 0.51%), and Salvadoran (31.8%, a difference of 0.55%).
| Demographics | Rating | Rank | Bachelor's Degree |
| Comanche | 0.2 /100 | #272 | Tragic 31.9% |
| Americans | 0.2 /100 | #273 | Tragic 31.9% |
| Potawatomi | 0.2 /100 | #274 | Tragic 31.9% |
| Samoans | 0.1 /100 | #275 | Tragic 31.8% |
| Salvadorans | 0.1 /100 | #276 | Tragic 31.8% |
| Dominicans | 0.1 /100 | #277 | Tragic 31.8% |
| Marshallese | 0.1 /100 | #278 | Tragic 31.7% |
| Hawaiians | 0.1 /100 | #279 | Tragic 31.6% |
| Immigrants | Laos | 0.1 /100 | #280 | Tragic 31.6% |
| Blackfeet | 0.1 /100 | #281 | Tragic 31.5% |
| Immigrants | Caribbean | 0.1 /100 | #282 | Tragic 31.4% |
| Hondurans | 0.1 /100 | #283 | Tragic 31.3% |
| Haitians | 0.1 /100 | #284 | Tragic 31.3% |
| Aleuts | 0.1 /100 | #285 | Tragic 31.3% |
| Immigrants | El Salvador | 0.1 /100 | #286 | Tragic 31.3% |