Immigrants from Kenya vs Immigrants from Peru In Labor Force | Age > 16
COMPARE
Immigrants from Kenya
Immigrants from Peru
In Labor Force | Age > 16
In Labor Force | Age > 16 Comparison
Immigrants from Kenya
Immigrants from Peru
67.6%
IN LABOR FORCE | AGE > 16
100.0/ 100
METRIC RATING
20th/ 347
METRIC RANK
66.3%
IN LABOR FORCE | AGE > 16
99.8/ 100
METRIC RATING
60th/ 347
METRIC RANK
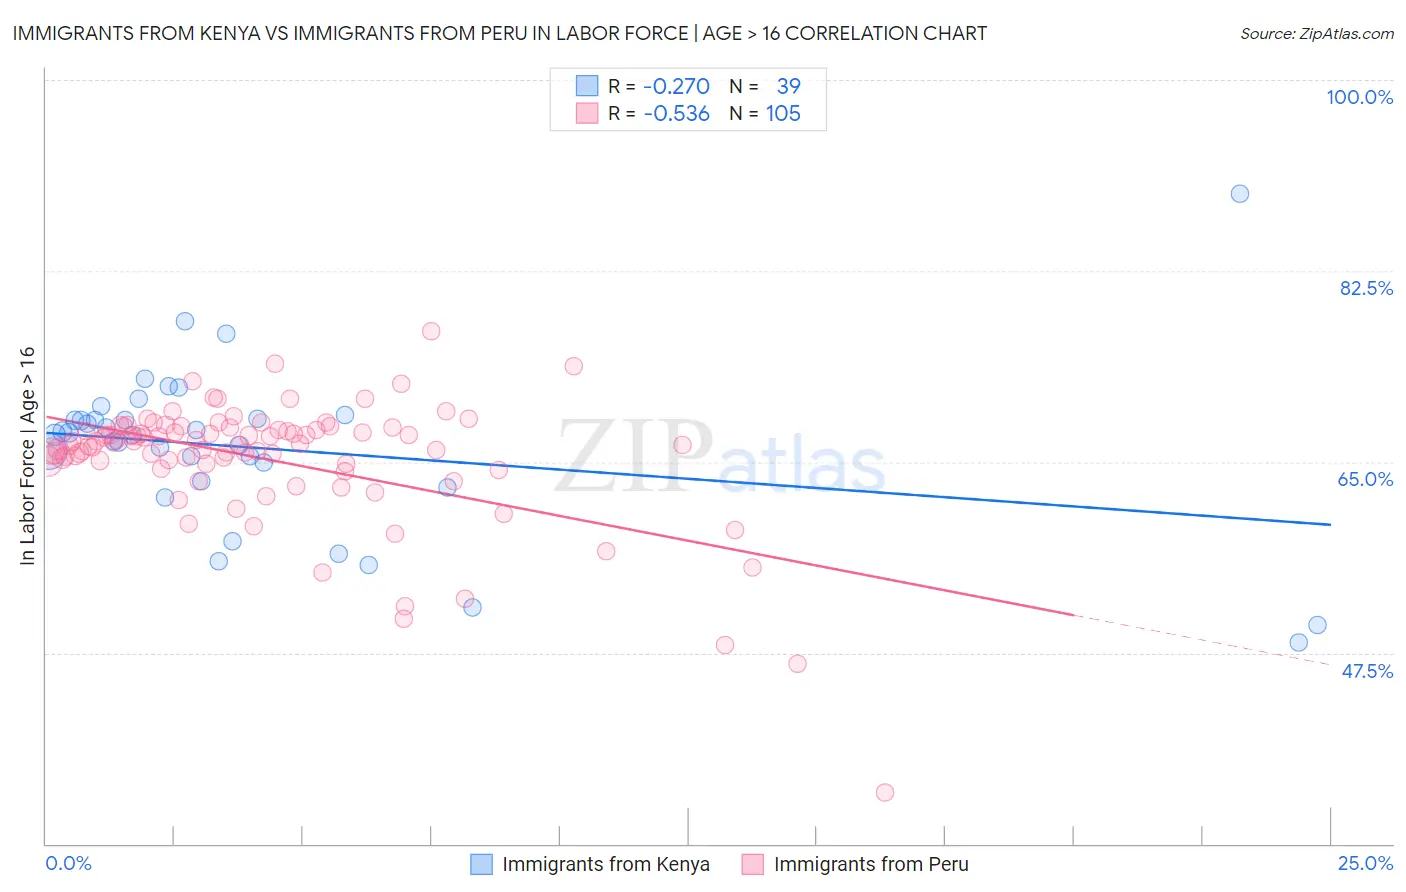
Immigrants from Kenya vs Immigrants from Peru In Labor Force | Age > 16 Correlation Chart
The statistical analysis conducted on geographies consisting of 218,088,200 people shows a weak negative correlation between the proportion of Immigrants from Kenya and labor force participation rate among population ages 16 and over in the United States with a correlation coefficient (R) of -0.270 and weighted average of 67.6%. Similarly, the statistical analysis conducted on geographies consisting of 328,856,106 people shows a substantial negative correlation between the proportion of Immigrants from Peru and labor force participation rate among population ages 16 and over in the United States with a correlation coefficient (R) of -0.536 and weighted average of 66.3%, a difference of 1.9%.
In Labor Force | Age > 16 Correlation Summary
| Measurement | Immigrants from Kenya | Immigrants from Peru |
| Minimum | 48.4% | 34.7% |
| Maximum | 89.6% | 77.0% |
| Range | 41.2% | 42.3% |
| Mean | 66.2% | 65.3% |
| Median | 67.4% | 66.7% |
| Interquartile 25% (IQ1) | 63.2% | 64.8% |
| Interquartile 75% (IQ3) | 69.0% | 68.1% |
| Interquartile Range (IQR) | 5.8% | 3.2% |
| Standard Deviation (Sample) | 7.6% | 5.8% |
| Standard Deviation (Population) | 7.5% | 5.8% |
Similar Demographics by In Labor Force | Age > 16
Demographics Similar to Immigrants from Kenya by In Labor Force | Age > 16
In terms of in labor force | age > 16, the demographic groups most similar to Immigrants from Kenya are Tongan (67.5%, a difference of 0.020%), Kenyan (67.6%, a difference of 0.050%), Immigrants from Uganda (67.5%, a difference of 0.080%), Immigrants from Liberia (67.6%, a difference of 0.090%), and Immigrants from India (67.6%, a difference of 0.10%).
| Demographics | Rating | Rank | In Labor Force | Age > 16 |
| Immigrants | Nepal | 100.0 /100 | #13 | Exceptional 68.0% |
| Liberians | 100.0 /100 | #14 | Exceptional 67.8% |
| Immigrants | Middle Africa | 100.0 /100 | #15 | Exceptional 67.7% |
| Immigrants | Sudan | 100.0 /100 | #16 | Exceptional 67.7% |
| Immigrants | India | 100.0 /100 | #17 | Exceptional 67.6% |
| Immigrants | Liberia | 100.0 /100 | #18 | Exceptional 67.6% |
| Kenyans | 100.0 /100 | #19 | Exceptional 67.6% |
| Immigrants | Kenya | 100.0 /100 | #20 | Exceptional 67.6% |
| Tongans | 100.0 /100 | #21 | Exceptional 67.5% |
| Immigrants | Uganda | 100.0 /100 | #22 | Exceptional 67.5% |
| Cambodians | 100.0 /100 | #23 | Exceptional 67.4% |
| Ugandans | 100.0 /100 | #24 | Exceptional 67.4% |
| Immigrants | Africa | 100.0 /100 | #25 | Exceptional 67.4% |
| Immigrants | Cabo Verde | 100.0 /100 | #26 | Exceptional 67.3% |
| Zimbabweans | 100.0 /100 | #27 | Exceptional 67.3% |
Demographics Similar to Immigrants from Peru by In Labor Force | Age > 16
In terms of in labor force | age > 16, the demographic groups most similar to Immigrants from Peru are Immigrants from Burma/Myanmar (66.3%, a difference of 0.0%), Indonesian (66.3%, a difference of 0.0%), Immigrants from Turkey (66.3%, a difference of 0.020%), Venezuelan (66.3%, a difference of 0.040%), and Peruvian (66.3%, a difference of 0.040%).
| Demographics | Rating | Rank | In Labor Force | Age > 16 |
| Immigrants | Sri Lanka | 99.9 /100 | #53 | Exceptional 66.5% |
| Immigrants | Bosnia and Herzegovina | 99.9 /100 | #54 | Exceptional 66.5% |
| Immigrants | Venezuela | 99.9 /100 | #55 | Exceptional 66.4% |
| Immigrants | Senegal | 99.9 /100 | #56 | Exceptional 66.4% |
| Bulgarians | 99.9 /100 | #57 | Exceptional 66.4% |
| Immigrants | Saudi Arabia | 99.9 /100 | #58 | Exceptional 66.3% |
| Immigrants | Turkey | 99.9 /100 | #59 | Exceptional 66.3% |
| Immigrants | Peru | 99.8 /100 | #60 | Exceptional 66.3% |
| Immigrants | Burma/Myanmar | 99.8 /100 | #61 | Exceptional 66.3% |
| Indonesians | 99.8 /100 | #62 | Exceptional 66.3% |
| Venezuelans | 99.8 /100 | #63 | Exceptional 66.3% |
| Peruvians | 99.8 /100 | #64 | Exceptional 66.3% |
| Sri Lankans | 99.8 /100 | #65 | Exceptional 66.3% |
| Jordanians | 99.8 /100 | #66 | Exceptional 66.3% |
| Egyptians | 99.8 /100 | #67 | Exceptional 66.2% |