Immigrants from Jordan vs Choctaw In Labor Force | Age > 16
COMPARE
Immigrants from Jordan
Choctaw
In Labor Force | Age > 16
In Labor Force | Age > 16 Comparison
Immigrants from Jordan
Choctaw
66.1%
IN LABOR FORCE | AGE > 16
99.4/ 100
METRIC RATING
83rd/ 347
METRIC RANK
61.5%
IN LABOR FORCE | AGE > 16
0.0/ 100
METRIC RATING
329th/ 347
METRIC RANK
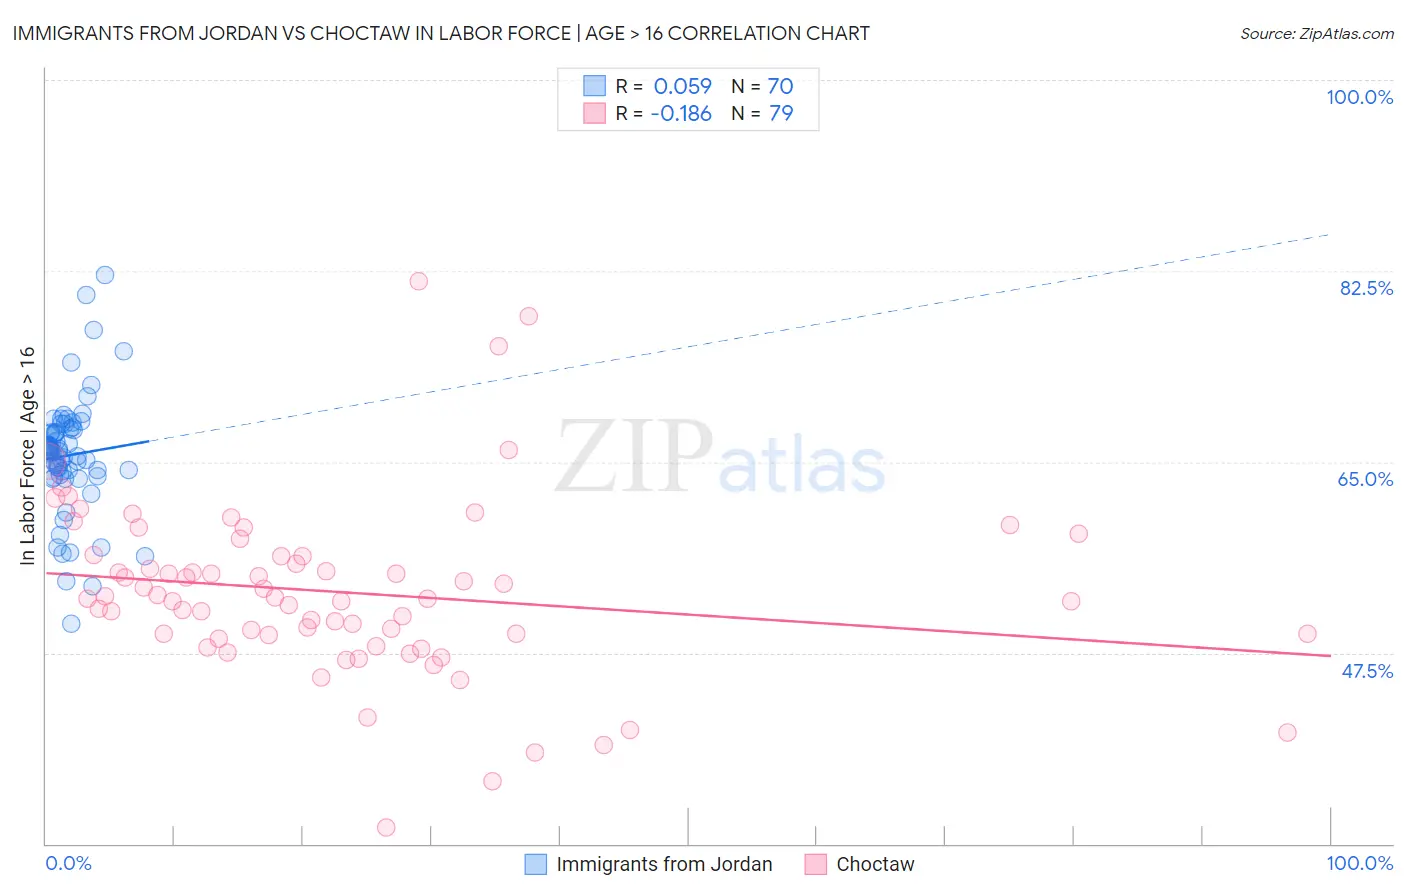
Immigrants from Jordan vs Choctaw In Labor Force | Age > 16 Correlation Chart
The statistical analysis conducted on geographies consisting of 181,280,783 people shows a slight positive correlation between the proportion of Immigrants from Jordan and labor force participation rate among population ages 16 and over in the United States with a correlation coefficient (R) of 0.059 and weighted average of 66.1%. Similarly, the statistical analysis conducted on geographies consisting of 269,719,523 people shows a poor negative correlation between the proportion of Choctaw and labor force participation rate among population ages 16 and over in the United States with a correlation coefficient (R) of -0.186 and weighted average of 61.5%, a difference of 7.5%.
In Labor Force | Age > 16 Correlation Summary
| Measurement | Immigrants from Jordan | Choctaw |
| Minimum | 50.2% | 31.5% |
| Maximum | 82.1% | 81.6% |
| Range | 31.9% | 50.1% |
| Mean | 65.6% | 53.1% |
| Median | 66.0% | 52.5% |
| Interquartile 25% (IQ1) | 63.8% | 49.1% |
| Interquartile 75% (IQ3) | 68.0% | 56.4% |
| Interquartile Range (IQR) | 4.2% | 7.2% |
| Standard Deviation (Sample) | 5.5% | 8.2% |
| Standard Deviation (Population) | 5.4% | 8.1% |
Similar Demographics by In Labor Force | Age > 16
Demographics Similar to Immigrants from Jordan by In Labor Force | Age > 16
In terms of in labor force | age > 16, the demographic groups most similar to Immigrants from Jordan are German Russian (66.1%, a difference of 0.0%), Central American (66.1%, a difference of 0.0%), Moroccan (66.1%, a difference of 0.010%), Mongolian (66.1%, a difference of 0.020%), and South American (66.0%, a difference of 0.040%).
| Demographics | Rating | Rank | In Labor Force | Age > 16 |
| Immigrants | Malaysia | 99.6 /100 | #76 | Exceptional 66.1% |
| Immigrants | Moldova | 99.6 /100 | #77 | Exceptional 66.1% |
| Immigrants | Asia | 99.6 /100 | #78 | Exceptional 66.1% |
| Turks | 99.6 /100 | #79 | Exceptional 66.1% |
| Malaysians | 99.6 /100 | #80 | Exceptional 66.1% |
| Moroccans | 99.5 /100 | #81 | Exceptional 66.1% |
| German Russians | 99.4 /100 | #82 | Exceptional 66.1% |
| Immigrants | Jordan | 99.4 /100 | #83 | Exceptional 66.1% |
| Central Americans | 99.4 /100 | #84 | Exceptional 66.1% |
| Mongolians | 99.4 /100 | #85 | Exceptional 66.1% |
| South Americans | 99.4 /100 | #86 | Exceptional 66.0% |
| South American Indians | 99.4 /100 | #87 | Exceptional 66.0% |
| Bermudans | 99.3 /100 | #88 | Exceptional 66.0% |
| Immigrants | Laos | 99.2 /100 | #89 | Exceptional 66.0% |
| Chileans | 99.2 /100 | #90 | Exceptional 66.0% |
Demographics Similar to Choctaw by In Labor Force | Age > 16
In terms of in labor force | age > 16, the demographic groups most similar to Choctaw are Creek (61.3%, a difference of 0.22%), Dutch West Indian (61.7%, a difference of 0.36%), Cajun (61.8%, a difference of 0.52%), Sioux (61.8%, a difference of 0.63%), and Cherokee (61.9%, a difference of 0.81%).
| Demographics | Rating | Rank | In Labor Force | Age > 16 |
| Ottawa | 0.0 /100 | #322 | Tragic 62.0% |
| Seminole | 0.0 /100 | #323 | Tragic 62.0% |
| Cheyenne | 0.0 /100 | #324 | Tragic 62.0% |
| Cherokee | 0.0 /100 | #325 | Tragic 61.9% |
| Sioux | 0.0 /100 | #326 | Tragic 61.8% |
| Cajuns | 0.0 /100 | #327 | Tragic 61.8% |
| Dutch West Indians | 0.0 /100 | #328 | Tragic 61.7% |
| Choctaw | 0.0 /100 | #329 | Tragic 61.5% |
| Creek | 0.0 /100 | #330 | Tragic 61.3% |
| Ute | 0.0 /100 | #331 | Tragic 60.9% |
| Crow | 0.0 /100 | #332 | Tragic 60.8% |
| Paiute | 0.0 /100 | #333 | Tragic 60.7% |
| Apache | 0.0 /100 | #334 | Tragic 60.7% |
| Natives/Alaskans | 0.0 /100 | #335 | Tragic 60.6% |
| Menominee | 0.0 /100 | #336 | Tragic 60.6% |