Immigrants from Jordan vs Immigrants from Denmark In Labor Force | Age > 16
COMPARE
Immigrants from Jordan
Immigrants from Denmark
In Labor Force | Age > 16
In Labor Force | Age > 16 Comparison
Immigrants from Jordan
Immigrants from Denmark
66.1%
IN LABOR FORCE | AGE > 16
99.4/ 100
METRIC RATING
83rd/ 347
METRIC RANK
64.8%
IN LABOR FORCE | AGE > 16
14.7/ 100
METRIC RATING
210th/ 347
METRIC RANK
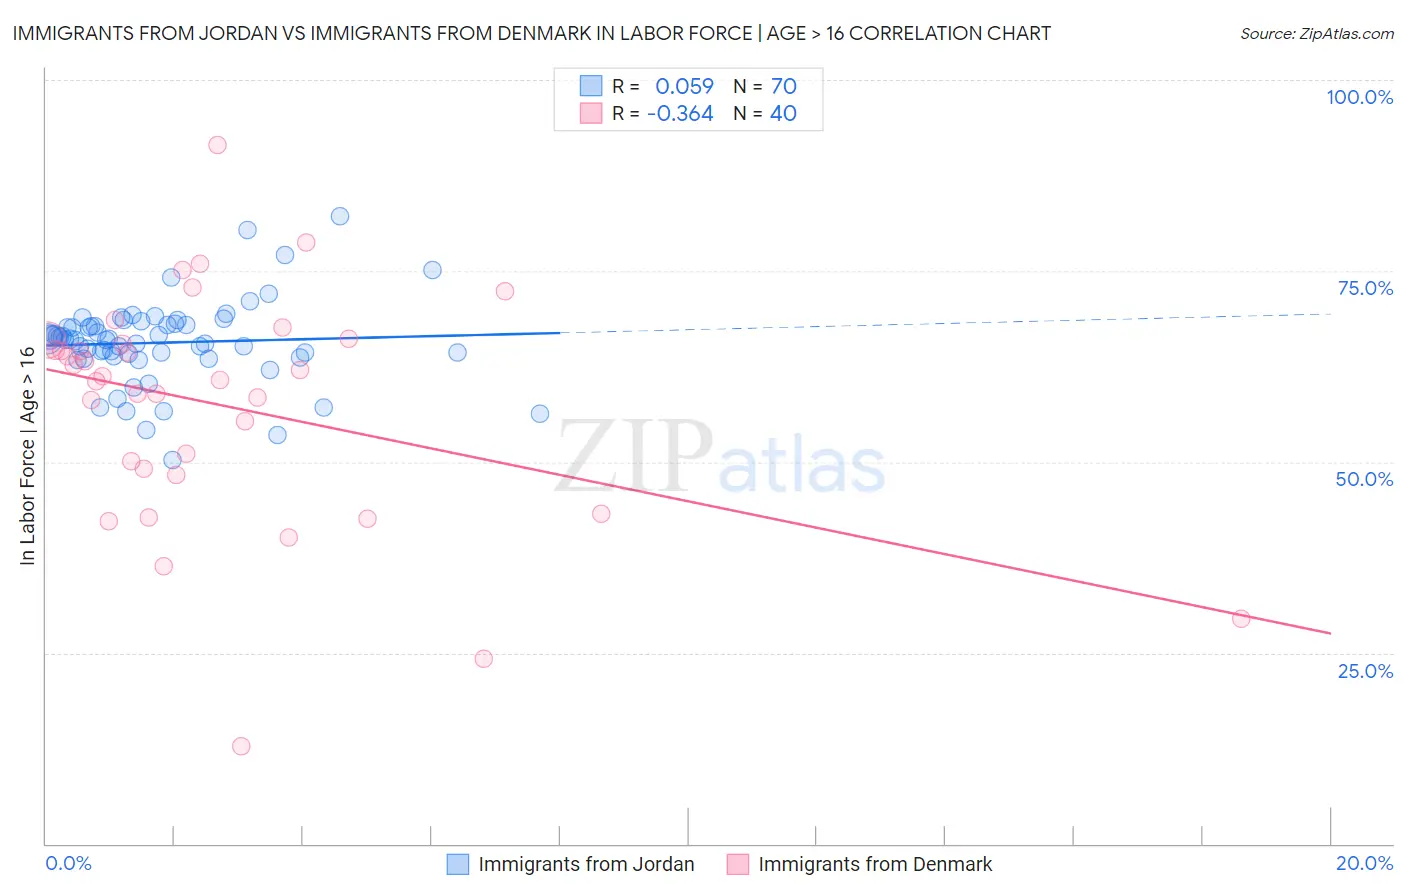
Immigrants from Jordan vs Immigrants from Denmark In Labor Force | Age > 16 Correlation Chart
The statistical analysis conducted on geographies consisting of 181,280,783 people shows a slight positive correlation between the proportion of Immigrants from Jordan and labor force participation rate among population ages 16 and over in the United States with a correlation coefficient (R) of 0.059 and weighted average of 66.1%. Similarly, the statistical analysis conducted on geographies consisting of 136,433,385 people shows a mild negative correlation between the proportion of Immigrants from Denmark and labor force participation rate among population ages 16 and over in the United States with a correlation coefficient (R) of -0.364 and weighted average of 64.8%, a difference of 1.9%.
In Labor Force | Age > 16 Correlation Summary
| Measurement | Immigrants from Jordan | Immigrants from Denmark |
| Minimum | 50.2% | 12.7% |
| Maximum | 82.1% | 91.5% |
| Range | 31.9% | 78.8% |
| Mean | 65.6% | 57.3% |
| Median | 66.0% | 61.0% |
| Interquartile 25% (IQ1) | 63.8% | 48.7% |
| Interquartile 75% (IQ3) | 68.0% | 65.6% |
| Interquartile Range (IQR) | 4.2% | 17.0% |
| Standard Deviation (Sample) | 5.5% | 15.4% |
| Standard Deviation (Population) | 5.4% | 15.2% |
Similar Demographics by In Labor Force | Age > 16
Demographics Similar to Immigrants from Jordan by In Labor Force | Age > 16
In terms of in labor force | age > 16, the demographic groups most similar to Immigrants from Jordan are German Russian (66.1%, a difference of 0.0%), Central American (66.1%, a difference of 0.0%), Moroccan (66.1%, a difference of 0.010%), Mongolian (66.1%, a difference of 0.020%), and South American (66.0%, a difference of 0.040%).
| Demographics | Rating | Rank | In Labor Force | Age > 16 |
| Immigrants | Malaysia | 99.6 /100 | #76 | Exceptional 66.1% |
| Immigrants | Moldova | 99.6 /100 | #77 | Exceptional 66.1% |
| Immigrants | Asia | 99.6 /100 | #78 | Exceptional 66.1% |
| Turks | 99.6 /100 | #79 | Exceptional 66.1% |
| Malaysians | 99.6 /100 | #80 | Exceptional 66.1% |
| Moroccans | 99.5 /100 | #81 | Exceptional 66.1% |
| German Russians | 99.4 /100 | #82 | Exceptional 66.1% |
| Immigrants | Jordan | 99.4 /100 | #83 | Exceptional 66.1% |
| Central Americans | 99.4 /100 | #84 | Exceptional 66.1% |
| Mongolians | 99.4 /100 | #85 | Exceptional 66.1% |
| South Americans | 99.4 /100 | #86 | Exceptional 66.0% |
| South American Indians | 99.4 /100 | #87 | Exceptional 66.0% |
| Bermudans | 99.3 /100 | #88 | Exceptional 66.0% |
| Immigrants | Laos | 99.2 /100 | #89 | Exceptional 66.0% |
| Chileans | 99.2 /100 | #90 | Exceptional 66.0% |
Demographics Similar to Immigrants from Denmark by In Labor Force | Age > 16
In terms of in labor force | age > 16, the demographic groups most similar to Immigrants from Denmark are Fijian (64.8%, a difference of 0.010%), Immigrants from Trinidad and Tobago (64.8%, a difference of 0.020%), Alaskan Athabascan (64.8%, a difference of 0.020%), Maltese (64.8%, a difference of 0.020%), and Belizean (64.8%, a difference of 0.030%).
| Demographics | Rating | Rank | In Labor Force | Age > 16 |
| Russians | 18.8 /100 | #203 | Poor 64.9% |
| Slovenes | 18.7 /100 | #204 | Poor 64.9% |
| Jamaicans | 18.7 /100 | #205 | Poor 64.9% |
| Lithuanians | 17.4 /100 | #206 | Poor 64.8% |
| Immigrants | Latin America | 16.4 /100 | #207 | Poor 64.8% |
| Belizeans | 16.2 /100 | #208 | Poor 64.8% |
| Immigrants | Trinidad and Tobago | 15.6 /100 | #209 | Poor 64.8% |
| Immigrants | Denmark | 14.7 /100 | #210 | Poor 64.8% |
| Fijians | 14.1 /100 | #211 | Poor 64.8% |
| Alaskan Athabascans | 13.9 /100 | #212 | Poor 64.8% |
| Maltese | 13.8 /100 | #213 | Poor 64.8% |
| Estonians | 13.1 /100 | #214 | Poor 64.8% |
| Immigrants | Czechoslovakia | 12.3 /100 | #215 | Poor 64.8% |
| Belgians | 11.4 /100 | #216 | Poor 64.7% |
| U.S. Virgin Islanders | 11.3 /100 | #217 | Poor 64.7% |