Immigrants from Vietnam vs Choctaw In Labor Force | Age > 16
COMPARE
Immigrants from Vietnam
Choctaw
In Labor Force | Age > 16
In Labor Force | Age > 16 Comparison
Immigrants from Vietnam
Choctaw
66.2%
IN LABOR FORCE | AGE > 16
99.7/ 100
METRIC RATING
73rd/ 347
METRIC RANK
61.5%
IN LABOR FORCE | AGE > 16
0.0/ 100
METRIC RATING
329th/ 347
METRIC RANK
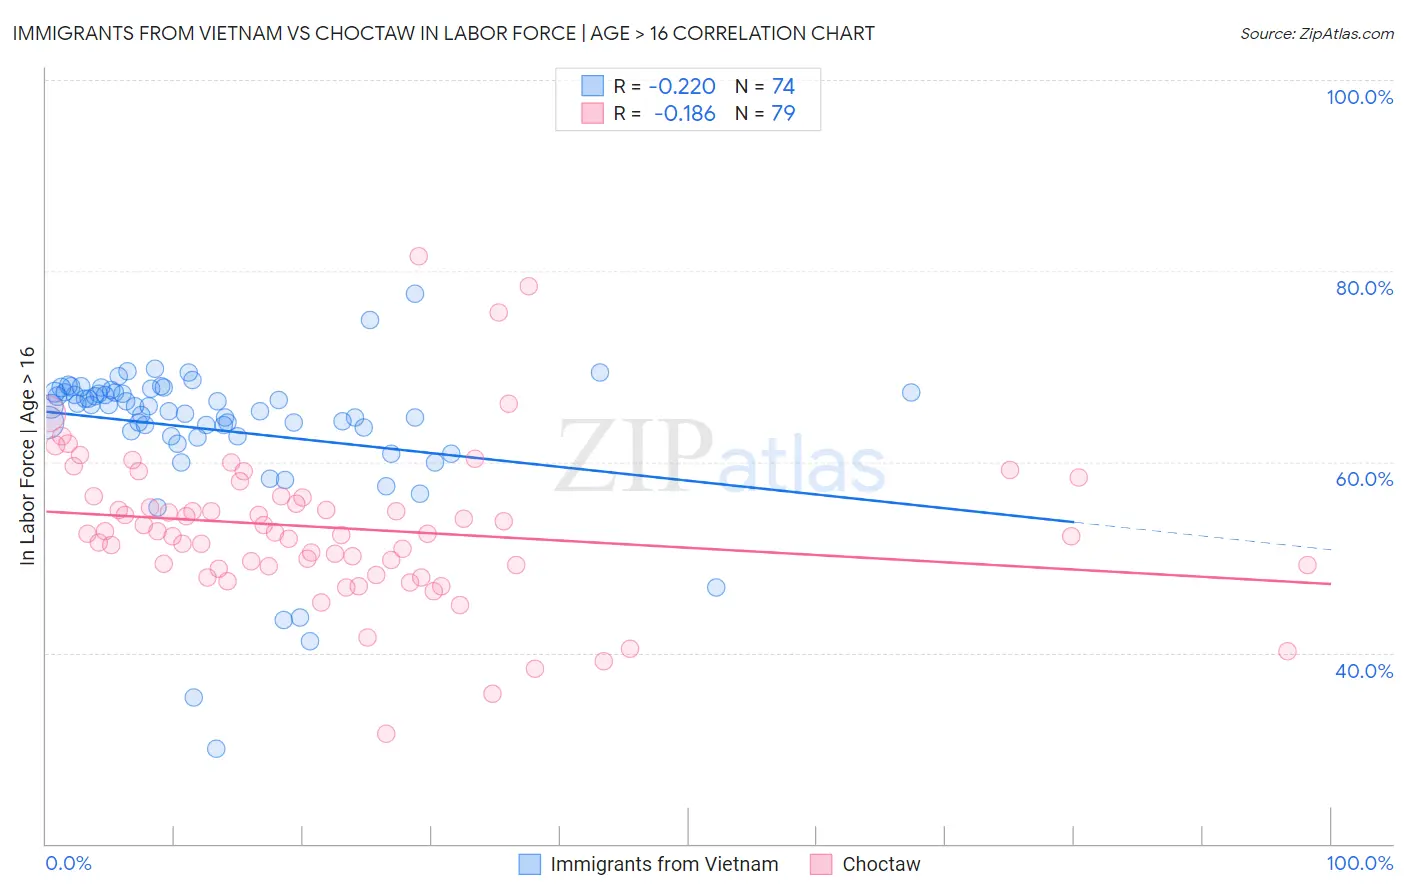
Immigrants from Vietnam vs Choctaw In Labor Force | Age > 16 Correlation Chart
The statistical analysis conducted on geographies consisting of 404,839,190 people shows a weak negative correlation between the proportion of Immigrants from Vietnam and labor force participation rate among population ages 16 and over in the United States with a correlation coefficient (R) of -0.220 and weighted average of 66.2%. Similarly, the statistical analysis conducted on geographies consisting of 269,719,523 people shows a poor negative correlation between the proportion of Choctaw and labor force participation rate among population ages 16 and over in the United States with a correlation coefficient (R) of -0.186 and weighted average of 61.5%, a difference of 7.7%.
In Labor Force | Age > 16 Correlation Summary
| Measurement | Immigrants from Vietnam | Choctaw |
| Minimum | 30.0% | 31.5% |
| Maximum | 77.6% | 81.6% |
| Range | 47.6% | 50.1% |
| Mean | 63.4% | 53.1% |
| Median | 65.8% | 52.5% |
| Interquartile 25% (IQ1) | 62.7% | 49.1% |
| Interquartile 75% (IQ3) | 67.3% | 56.4% |
| Interquartile Range (IQR) | 4.6% | 7.2% |
| Standard Deviation (Sample) | 8.0% | 8.2% |
| Standard Deviation (Population) | 7.9% | 8.1% |
Similar Demographics by In Labor Force | Age > 16
Demographics Similar to Immigrants from Vietnam by In Labor Force | Age > 16
In terms of in labor force | age > 16, the demographic groups most similar to Immigrants from Vietnam are Immigrants from Korea (66.2%, a difference of 0.0%), Burmese (66.2%, a difference of 0.010%), Taiwanese (66.2%, a difference of 0.010%), Immigrants from Singapore (66.2%, a difference of 0.010%), and Asian (66.2%, a difference of 0.030%).
| Demographics | Rating | Rank | In Labor Force | Age > 16 |
| Jordanians | 99.8 /100 | #66 | Exceptional 66.3% |
| Egyptians | 99.8 /100 | #67 | Exceptional 66.2% |
| Immigrants | Egypt | 99.7 /100 | #68 | Exceptional 66.2% |
| Sub-Saharan Africans | 99.7 /100 | #69 | Exceptional 66.2% |
| Asians | 99.7 /100 | #70 | Exceptional 66.2% |
| Burmese | 99.7 /100 | #71 | Exceptional 66.2% |
| Taiwanese | 99.7 /100 | #72 | Exceptional 66.2% |
| Immigrants | Vietnam | 99.7 /100 | #73 | Exceptional 66.2% |
| Immigrants | Korea | 99.7 /100 | #74 | Exceptional 66.2% |
| Immigrants | Singapore | 99.7 /100 | #75 | Exceptional 66.2% |
| Immigrants | Malaysia | 99.6 /100 | #76 | Exceptional 66.1% |
| Immigrants | Moldova | 99.6 /100 | #77 | Exceptional 66.1% |
| Immigrants | Asia | 99.6 /100 | #78 | Exceptional 66.1% |
| Turks | 99.6 /100 | #79 | Exceptional 66.1% |
| Malaysians | 99.6 /100 | #80 | Exceptional 66.1% |
Demographics Similar to Choctaw by In Labor Force | Age > 16
In terms of in labor force | age > 16, the demographic groups most similar to Choctaw are Creek (61.3%, a difference of 0.22%), Dutch West Indian (61.7%, a difference of 0.36%), Cajun (61.8%, a difference of 0.52%), Sioux (61.8%, a difference of 0.63%), and Cherokee (61.9%, a difference of 0.81%).
| Demographics | Rating | Rank | In Labor Force | Age > 16 |
| Ottawa | 0.0 /100 | #322 | Tragic 62.0% |
| Seminole | 0.0 /100 | #323 | Tragic 62.0% |
| Cheyenne | 0.0 /100 | #324 | Tragic 62.0% |
| Cherokee | 0.0 /100 | #325 | Tragic 61.9% |
| Sioux | 0.0 /100 | #326 | Tragic 61.8% |
| Cajuns | 0.0 /100 | #327 | Tragic 61.8% |
| Dutch West Indians | 0.0 /100 | #328 | Tragic 61.7% |
| Choctaw | 0.0 /100 | #329 | Tragic 61.5% |
| Creek | 0.0 /100 | #330 | Tragic 61.3% |
| Ute | 0.0 /100 | #331 | Tragic 60.9% |
| Crow | 0.0 /100 | #332 | Tragic 60.8% |
| Paiute | 0.0 /100 | #333 | Tragic 60.7% |
| Apache | 0.0 /100 | #334 | Tragic 60.7% |
| Natives/Alaskans | 0.0 /100 | #335 | Tragic 60.6% |
| Menominee | 0.0 /100 | #336 | Tragic 60.6% |