Immigrants from Jordan vs Choctaw Average Family Size
COMPARE
Immigrants from Jordan
Choctaw
Average Family Size
Average Family Size Comparison
Immigrants from Jordan
Choctaw
3.24
AVERAGE FAMILY SIZE
75.7/ 100
METRIC RATING
147th/ 347
METRIC RANK
3.21
AVERAGE FAMILY SIZE
28.3/ 100
METRIC RATING
195th/ 347
METRIC RANK
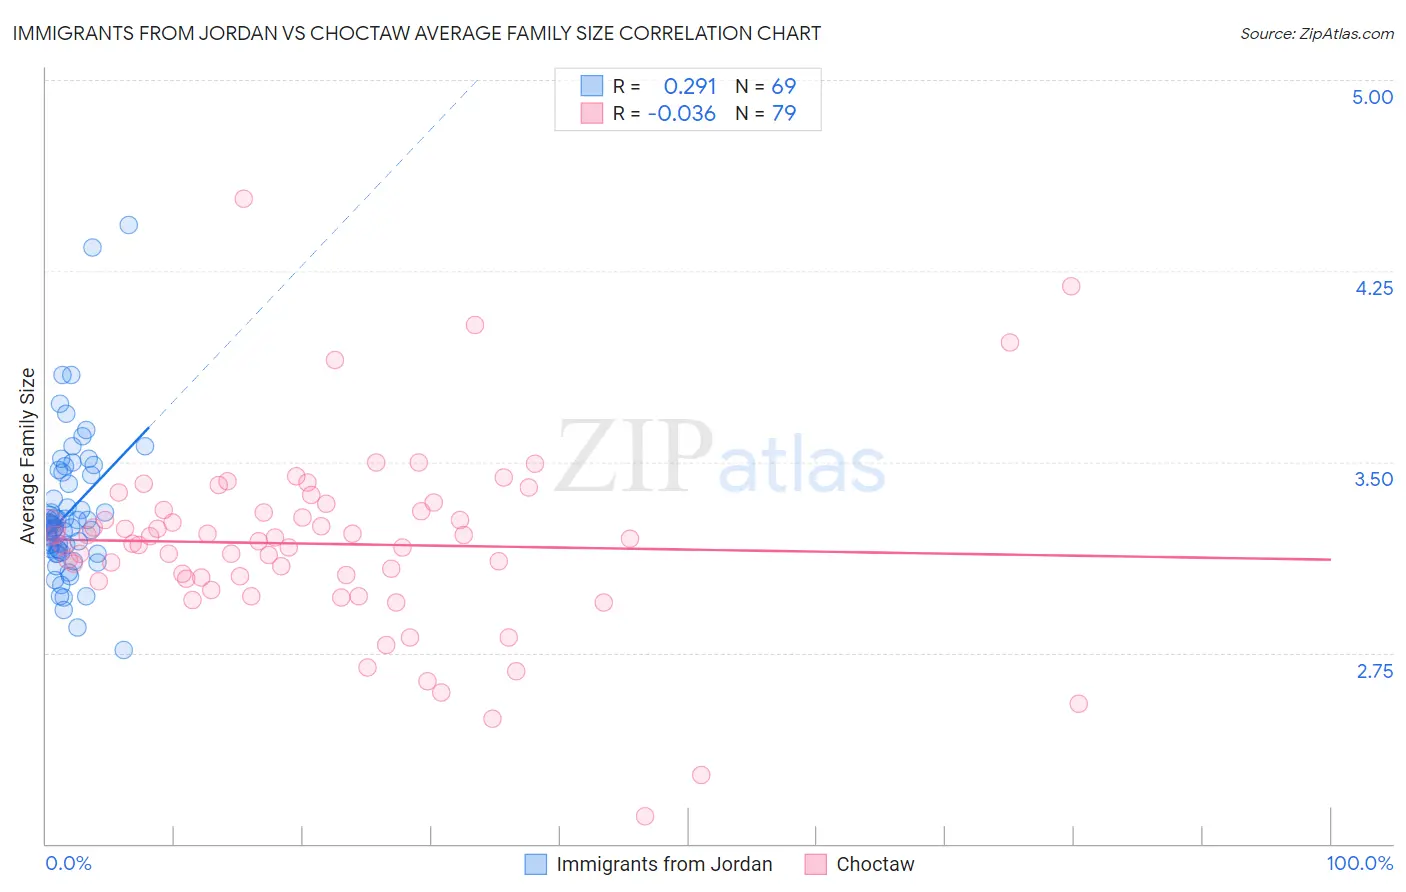
Immigrants from Jordan vs Choctaw Average Family Size Correlation Chart
The statistical analysis conducted on geographies consisting of 181,252,628 people shows a weak positive correlation between the proportion of Immigrants from Jordan and average family size in the United States with a correlation coefficient (R) of 0.291 and weighted average of 3.24. Similarly, the statistical analysis conducted on geographies consisting of 269,626,906 people shows no correlation between the proportion of Choctaw and average family size in the United States with a correlation coefficient (R) of -0.036 and weighted average of 3.21, a difference of 0.94%.
Average Family Size Correlation Summary
| Measurement | Immigrants from Jordan | Choctaw |
| Minimum | 2.76 | 2.11 |
| Maximum | 4.43 | 4.53 |
| Range | 1.67 | 2.42 |
| Mean | 3.30 | 3.18 |
| Median | 3.25 | 3.19 |
| Interquartile 25% (IQ1) | 3.15 | 3.04 |
| Interquartile 75% (IQ3) | 3.45 | 3.31 |
| Interquartile Range (IQR) | 0.30 | 0.27 |
| Standard Deviation (Sample) | 0.29 | 0.37 |
| Standard Deviation (Population) | 0.28 | 0.37 |
Similar Demographics by Average Family Size
Demographics Similar to Immigrants from Jordan by Average Family Size
In terms of average family size, the demographic groups most similar to Immigrants from Jordan are Blackfeet (3.24, a difference of 0.020%), Assyrian/Chaldean/Syriac (3.24, a difference of 0.050%), Indian (Asian) (3.24, a difference of 0.050%), Jordanian (3.24, a difference of 0.050%), and Armenian (3.25, a difference of 0.060%).
| Demographics | Rating | Rank | Average Family Size |
| Sub-Saharan Africans | 81.6 /100 | #140 | Excellent 3.25 |
| Venezuelans | 81.4 /100 | #141 | Excellent 3.25 |
| Liberians | 81.2 /100 | #142 | Excellent 3.25 |
| Bhutanese | 81.0 /100 | #143 | Excellent 3.25 |
| Tsimshian | 80.2 /100 | #144 | Excellent 3.25 |
| Armenians | 78.2 /100 | #145 | Good 3.25 |
| Immigrants | Africa | 77.9 /100 | #146 | Good 3.25 |
| Immigrants | Jordan | 75.7 /100 | #147 | Good 3.24 |
| Blackfeet | 75.0 /100 | #148 | Good 3.24 |
| Assyrians/Chaldeans/Syriacs | 73.8 /100 | #149 | Good 3.24 |
| Indians (Asian) | 73.6 /100 | #150 | Good 3.24 |
| Jordanians | 73.5 /100 | #151 | Good 3.24 |
| Spanish Americans | 72.5 /100 | #152 | Good 3.24 |
| Immigrants | Eritrea | 71.4 /100 | #153 | Good 3.24 |
| Immigrants | Egypt | 70.0 /100 | #154 | Good 3.24 |
Demographics Similar to Choctaw by Average Family Size
In terms of average family size, the demographic groups most similar to Choctaw are Senegalese (3.21, a difference of 0.0%), Kenyan (3.21, a difference of 0.010%), Immigrants from Israel (3.22, a difference of 0.020%), Immigrants from Sudan (3.22, a difference of 0.020%), and Immigrants from Eastern Africa (3.22, a difference of 0.040%).
| Demographics | Rating | Rank | Average Family Size |
| Thais | 38.3 /100 | #188 | Fair 3.22 |
| Pakistanis | 33.7 /100 | #189 | Fair 3.22 |
| Burmese | 31.0 /100 | #190 | Fair 3.22 |
| Immigrants | Zaire | 30.5 /100 | #191 | Fair 3.22 |
| Immigrants | Eastern Africa | 30.1 /100 | #192 | Fair 3.22 |
| Immigrants | Israel | 29.3 /100 | #193 | Fair 3.22 |
| Immigrants | Sudan | 29.1 /100 | #194 | Fair 3.22 |
| Choctaw | 28.3 /100 | #195 | Fair 3.21 |
| Senegalese | 28.2 /100 | #196 | Fair 3.21 |
| Kenyans | 28.0 /100 | #197 | Fair 3.21 |
| Immigrants | Azores | 21.7 /100 | #198 | Fair 3.21 |
| Hmong | 20.7 /100 | #199 | Fair 3.21 |
| Immigrants | Kenya | 19.2 /100 | #200 | Poor 3.21 |
| Immigrants | Morocco | 18.5 /100 | #201 | Poor 3.21 |
| Immigrants | India | 18.5 /100 | #202 | Poor 3.21 |