Immigrants from Jordan vs Comanche In Labor Force | Age > 16
COMPARE
Immigrants from Jordan
Comanche
In Labor Force | Age > 16
In Labor Force | Age > 16 Comparison
Immigrants from Jordan
Comanche
66.1%
IN LABOR FORCE | AGE > 16
99.4/ 100
METRIC RATING
83rd/ 347
METRIC RANK
63.6%
IN LABOR FORCE | AGE > 16
0.0/ 100
METRIC RATING
298th/ 347
METRIC RANK
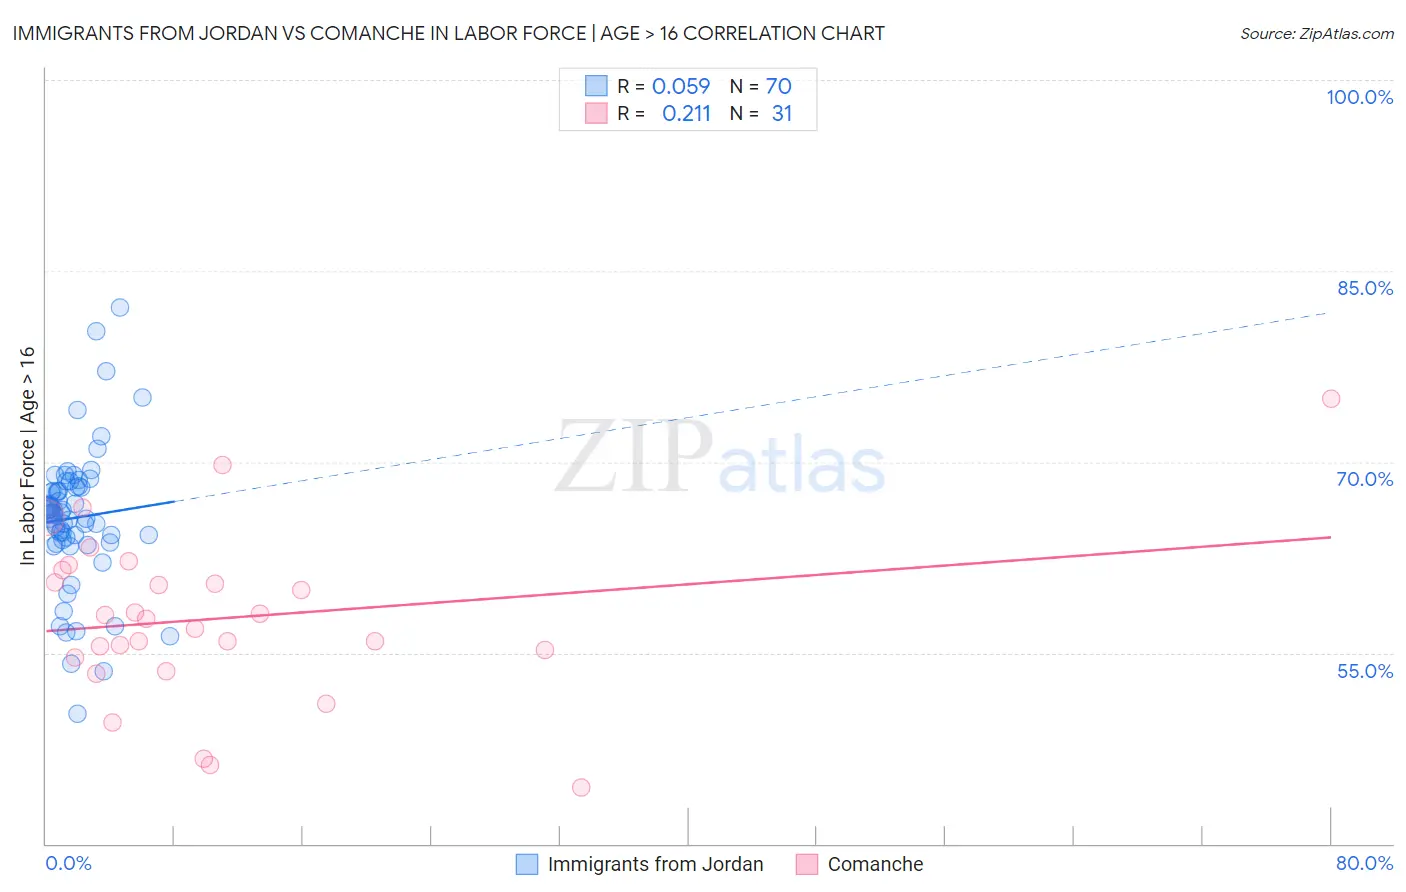
Immigrants from Jordan vs Comanche In Labor Force | Age > 16 Correlation Chart
The statistical analysis conducted on geographies consisting of 181,280,783 people shows a slight positive correlation between the proportion of Immigrants from Jordan and labor force participation rate among population ages 16 and over in the United States with a correlation coefficient (R) of 0.059 and weighted average of 66.1%. Similarly, the statistical analysis conducted on geographies consisting of 109,783,732 people shows a weak positive correlation between the proportion of Comanche and labor force participation rate among population ages 16 and over in the United States with a correlation coefficient (R) of 0.211 and weighted average of 63.6%, a difference of 3.8%.
In Labor Force | Age > 16 Correlation Summary
| Measurement | Immigrants from Jordan | Comanche |
| Minimum | 50.2% | 44.4% |
| Maximum | 82.1% | 75.0% |
| Range | 31.9% | 30.6% |
| Mean | 65.6% | 57.7% |
| Median | 66.0% | 57.7% |
| Interquartile 25% (IQ1) | 63.8% | 54.7% |
| Interquartile 75% (IQ3) | 68.0% | 61.5% |
| Interquartile Range (IQR) | 4.2% | 6.9% |
| Standard Deviation (Sample) | 5.5% | 6.6% |
| Standard Deviation (Population) | 5.4% | 6.5% |
Similar Demographics by In Labor Force | Age > 16
Demographics Similar to Immigrants from Jordan by In Labor Force | Age > 16
In terms of in labor force | age > 16, the demographic groups most similar to Immigrants from Jordan are German Russian (66.1%, a difference of 0.0%), Central American (66.1%, a difference of 0.0%), Moroccan (66.1%, a difference of 0.010%), Mongolian (66.1%, a difference of 0.020%), and South American (66.0%, a difference of 0.040%).
| Demographics | Rating | Rank | In Labor Force | Age > 16 |
| Immigrants | Malaysia | 99.6 /100 | #76 | Exceptional 66.1% |
| Immigrants | Moldova | 99.6 /100 | #77 | Exceptional 66.1% |
| Immigrants | Asia | 99.6 /100 | #78 | Exceptional 66.1% |
| Turks | 99.6 /100 | #79 | Exceptional 66.1% |
| Malaysians | 99.6 /100 | #80 | Exceptional 66.1% |
| Moroccans | 99.5 /100 | #81 | Exceptional 66.1% |
| German Russians | 99.4 /100 | #82 | Exceptional 66.1% |
| Immigrants | Jordan | 99.4 /100 | #83 | Exceptional 66.1% |
| Central Americans | 99.4 /100 | #84 | Exceptional 66.1% |
| Mongolians | 99.4 /100 | #85 | Exceptional 66.1% |
| South Americans | 99.4 /100 | #86 | Exceptional 66.0% |
| South American Indians | 99.4 /100 | #87 | Exceptional 66.0% |
| Bermudans | 99.3 /100 | #88 | Exceptional 66.0% |
| Immigrants | Laos | 99.2 /100 | #89 | Exceptional 66.0% |
| Chileans | 99.2 /100 | #90 | Exceptional 66.0% |
Demographics Similar to Comanche by In Labor Force | Age > 16
In terms of in labor force | age > 16, the demographic groups most similar to Comanche are Immigrants from Grenada (63.6%, a difference of 0.010%), White/Caucasian (63.6%, a difference of 0.060%), Immigrants from the Azores (63.6%, a difference of 0.060%), Immigrants from North America (63.7%, a difference of 0.090%), and Spanish American (63.6%, a difference of 0.090%).
| Demographics | Rating | Rank | In Labor Force | Age > 16 |
| Nepalese | 0.1 /100 | #291 | Tragic 63.8% |
| Spanish American Indians | 0.1 /100 | #292 | Tragic 63.8% |
| English | 0.1 /100 | #293 | Tragic 63.7% |
| Puget Sound Salish | 0.0 /100 | #294 | Tragic 63.7% |
| Immigrants | Canada | 0.0 /100 | #295 | Tragic 63.7% |
| Immigrants | North America | 0.0 /100 | #296 | Tragic 63.7% |
| Immigrants | Grenada | 0.0 /100 | #297 | Tragic 63.6% |
| Comanche | 0.0 /100 | #298 | Tragic 63.6% |
| Whites/Caucasians | 0.0 /100 | #299 | Tragic 63.6% |
| Immigrants | Azores | 0.0 /100 | #300 | Tragic 63.6% |
| Spanish Americans | 0.0 /100 | #301 | Tragic 63.6% |
| Delaware | 0.0 /100 | #302 | Tragic 63.6% |
| Cree | 0.0 /100 | #303 | Tragic 63.5% |
| Immigrants | Nonimmigrants | 0.0 /100 | #304 | Tragic 63.5% |
| Osage | 0.0 /100 | #305 | Tragic 63.5% |