Serbian vs Choctaw In Labor Force | Age > 16
COMPARE
Serbian
Choctaw
In Labor Force | Age > 16
In Labor Force | Age > 16 Comparison
Serbians
Choctaw
65.2%
IN LABOR FORCE | AGE > 16
63.5/ 100
METRIC RATING
168th/ 347
METRIC RANK
61.5%
IN LABOR FORCE | AGE > 16
0.0/ 100
METRIC RATING
329th/ 347
METRIC RANK
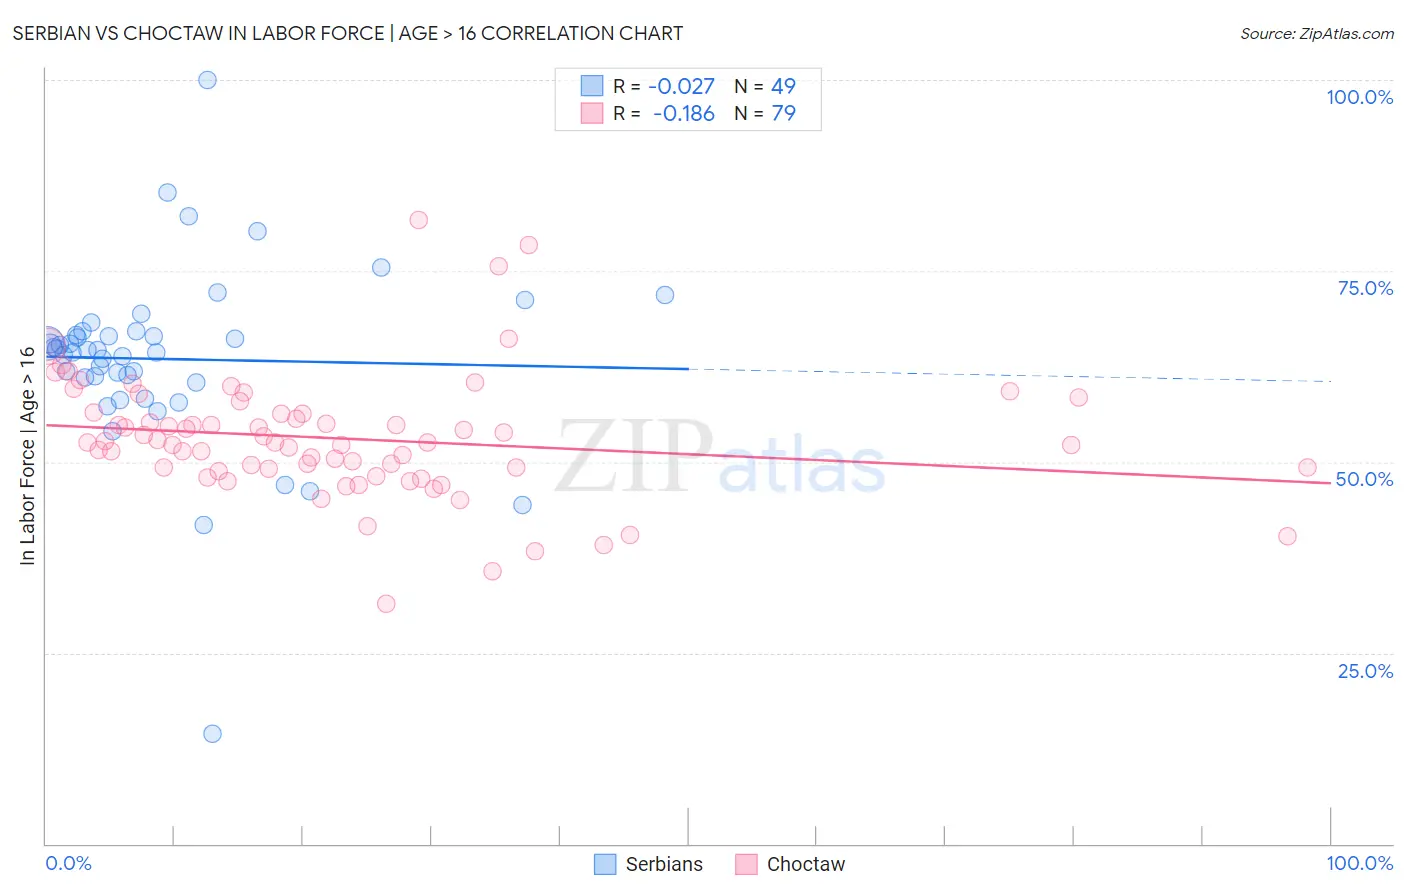
Serbian vs Choctaw In Labor Force | Age > 16 Correlation Chart
The statistical analysis conducted on geographies consisting of 267,655,125 people shows no correlation between the proportion of Serbians and labor force participation rate among population ages 16 and over in the United States with a correlation coefficient (R) of -0.027 and weighted average of 65.2%. Similarly, the statistical analysis conducted on geographies consisting of 269,719,523 people shows a poor negative correlation between the proportion of Choctaw and labor force participation rate among population ages 16 and over in the United States with a correlation coefficient (R) of -0.186 and weighted average of 61.5%, a difference of 6.1%.
In Labor Force | Age > 16 Correlation Summary
| Measurement | Serbian | Choctaw |
| Minimum | 14.4% | 31.5% |
| Maximum | 100.0% | 81.6% |
| Range | 85.6% | 50.1% |
| Mean | 63.5% | 53.1% |
| Median | 64.7% | 52.5% |
| Interquartile 25% (IQ1) | 60.8% | 49.1% |
| Interquartile 75% (IQ3) | 66.8% | 56.4% |
| Interquartile Range (IQR) | 6.1% | 7.2% |
| Standard Deviation (Sample) | 12.1% | 8.2% |
| Standard Deviation (Population) | 12.0% | 8.1% |
Similar Demographics by In Labor Force | Age > 16
Demographics Similar to Serbians by In Labor Force | Age > 16
In terms of in labor force | age > 16, the demographic groups most similar to Serbians are Arab (65.2%, a difference of 0.010%), Immigrants from Israel (65.2%, a difference of 0.020%), Israeli (65.2%, a difference of 0.020%), Immigrants from Belarus (65.2%, a difference of 0.030%), and Immigrants from Sweden (65.2%, a difference of 0.030%).
| Demographics | Rating | Rank | In Labor Force | Age > 16 |
| Australians | 71.3 /100 | #161 | Good 65.3% |
| Albanians | 70.8 /100 | #162 | Good 65.3% |
| South Africans | 69.8 /100 | #163 | Good 65.3% |
| Danes | 68.8 /100 | #164 | Good 65.3% |
| Immigrants | Kazakhstan | 68.1 /100 | #165 | Good 65.3% |
| Immigrants | Western Asia | 67.3 /100 | #166 | Good 65.3% |
| Immigrants | Belarus | 66.0 /100 | #167 | Good 65.2% |
| Serbians | 63.5 /100 | #168 | Good 65.2% |
| Arabs | 62.4 /100 | #169 | Good 65.2% |
| Immigrants | Israel | 61.7 /100 | #170 | Good 65.2% |
| Israelis | 61.6 /100 | #171 | Good 65.2% |
| Immigrants | Sweden | 61.3 /100 | #172 | Good 65.2% |
| Immigrants | Ukraine | 53.7 /100 | #173 | Average 65.1% |
| Macedonians | 50.0 /100 | #174 | Average 65.1% |
| Nicaraguans | 49.7 /100 | #175 | Average 65.1% |
Demographics Similar to Choctaw by In Labor Force | Age > 16
In terms of in labor force | age > 16, the demographic groups most similar to Choctaw are Creek (61.3%, a difference of 0.22%), Dutch West Indian (61.7%, a difference of 0.36%), Cajun (61.8%, a difference of 0.52%), Sioux (61.8%, a difference of 0.63%), and Cherokee (61.9%, a difference of 0.81%).
| Demographics | Rating | Rank | In Labor Force | Age > 16 |
| Ottawa | 0.0 /100 | #322 | Tragic 62.0% |
| Seminole | 0.0 /100 | #323 | Tragic 62.0% |
| Cheyenne | 0.0 /100 | #324 | Tragic 62.0% |
| Cherokee | 0.0 /100 | #325 | Tragic 61.9% |
| Sioux | 0.0 /100 | #326 | Tragic 61.8% |
| Cajuns | 0.0 /100 | #327 | Tragic 61.8% |
| Dutch West Indians | 0.0 /100 | #328 | Tragic 61.7% |
| Choctaw | 0.0 /100 | #329 | Tragic 61.5% |
| Creek | 0.0 /100 | #330 | Tragic 61.3% |
| Ute | 0.0 /100 | #331 | Tragic 60.9% |
| Crow | 0.0 /100 | #332 | Tragic 60.8% |
| Paiute | 0.0 /100 | #333 | Tragic 60.7% |
| Apache | 0.0 /100 | #334 | Tragic 60.7% |
| Natives/Alaskans | 0.0 /100 | #335 | Tragic 60.6% |
| Menominee | 0.0 /100 | #336 | Tragic 60.6% |