Immigrants from Italy vs Indonesian In Labor Force | Age 20-24
COMPARE
Immigrants from Italy
Indonesian
In Labor Force | Age 20-24
In Labor Force | Age 20-24 Comparison
Immigrants from Italy
Indonesians
74.6%
IN LABOR FORCE | AGE 20-24
17.6/ 100
METRIC RATING
204th/ 347
METRIC RANK
77.2%
IN LABOR FORCE | AGE 20-24
100.0/ 100
METRIC RATING
52nd/ 347
METRIC RANK
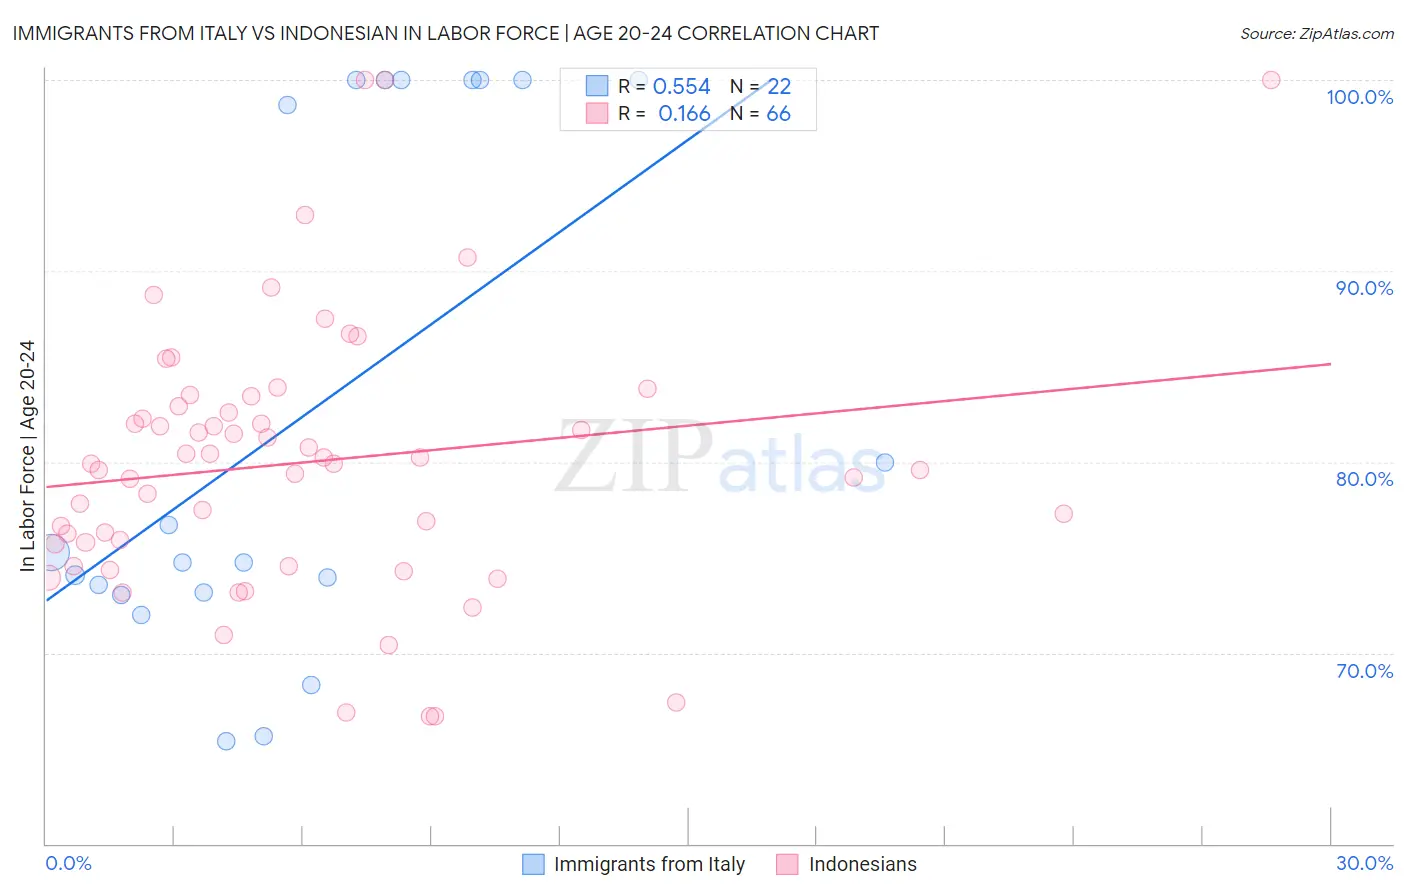
Immigrants from Italy vs Indonesian In Labor Force | Age 20-24 Correlation Chart
The statistical analysis conducted on geographies consisting of 324,060,092 people shows a substantial positive correlation between the proportion of Immigrants from Italy and labor force participation rate among population between the ages 20 and 24 in the United States with a correlation coefficient (R) of 0.554 and weighted average of 74.6%. Similarly, the statistical analysis conducted on geographies consisting of 162,737,934 people shows a poor positive correlation between the proportion of Indonesians and labor force participation rate among population between the ages 20 and 24 in the United States with a correlation coefficient (R) of 0.166 and weighted average of 77.2%, a difference of 3.5%.
In Labor Force | Age 20-24 Correlation Summary
| Measurement | Immigrants from Italy | Indonesian |
| Minimum | 65.4% | 66.7% |
| Maximum | 100.0% | 100.0% |
| Range | 34.6% | 33.3% |
| Mean | 82.7% | 80.0% |
| Median | 75.0% | 79.9% |
| Interquartile 25% (IQ1) | 73.2% | 75.7% |
| Interquartile 75% (IQ3) | 100.0% | 82.9% |
| Interquartile Range (IQR) | 26.8% | 7.2% |
| Standard Deviation (Sample) | 13.6% | 7.1% |
| Standard Deviation (Population) | 13.3% | 7.1% |
Similar Demographics by In Labor Force | Age 20-24
Demographics Similar to Immigrants from Italy by In Labor Force | Age 20-24
In terms of in labor force | age 20-24, the demographic groups most similar to Immigrants from Italy are Inupiat (74.6%, a difference of 0.0%), Sioux (74.6%, a difference of 0.0%), Immigrants from Northern Africa (74.6%, a difference of 0.010%), Albanian (74.6%, a difference of 0.040%), and Immigrants from Uruguay (74.6%, a difference of 0.050%).
| Demographics | Rating | Rank | In Labor Force | Age 20-24 |
| Panamanians | 25.0 /100 | #197 | Fair 74.7% |
| Immigrants | Nigeria | 24.2 /100 | #198 | Fair 74.7% |
| Taiwanese | 23.2 /100 | #199 | Fair 74.7% |
| Nigerians | 21.9 /100 | #200 | Fair 74.7% |
| Choctaw | 21.4 /100 | #201 | Fair 74.7% |
| Moroccans | 20.4 /100 | #202 | Fair 74.7% |
| Immigrants | Northern Africa | 17.9 /100 | #203 | Poor 74.6% |
| Immigrants | Italy | 17.6 /100 | #204 | Poor 74.6% |
| Inupiat | 17.6 /100 | #205 | Poor 74.6% |
| Sioux | 17.5 /100 | #206 | Poor 74.6% |
| Albanians | 16.2 /100 | #207 | Poor 74.6% |
| Immigrants | Uruguay | 15.8 /100 | #208 | Poor 74.6% |
| Arabs | 15.8 /100 | #209 | Poor 74.6% |
| Uruguayans | 15.1 /100 | #210 | Poor 74.6% |
| Immigrants | Australia | 14.7 /100 | #211 | Poor 74.6% |
Demographics Similar to Indonesians by In Labor Force | Age 20-24
In terms of in labor force | age 20-24, the demographic groups most similar to Indonesians are Croatian (77.2%, a difference of 0.010%), Immigrants from the Azores (77.2%, a difference of 0.010%), Malaysian (77.2%, a difference of 0.020%), Serbian (77.3%, a difference of 0.060%), and Chinese (77.3%, a difference of 0.060%).
| Demographics | Rating | Rank | In Labor Force | Age 20-24 |
| Native Hawaiians | 100.0 /100 | #45 | Exceptional 77.4% |
| Samoans | 100.0 /100 | #46 | Exceptional 77.4% |
| Ethiopians | 100.0 /100 | #47 | Exceptional 77.3% |
| Serbians | 100.0 /100 | #48 | Exceptional 77.3% |
| Chinese | 100.0 /100 | #49 | Exceptional 77.3% |
| Malaysians | 100.0 /100 | #50 | Exceptional 77.2% |
| Croatians | 100.0 /100 | #51 | Exceptional 77.2% |
| Indonesians | 100.0 /100 | #52 | Exceptional 77.2% |
| Immigrants | Azores | 100.0 /100 | #53 | Exceptional 77.2% |
| Celtics | 99.9 /100 | #54 | Exceptional 77.1% |
| Immigrants | Liberia | 99.9 /100 | #55 | Exceptional 77.1% |
| Europeans | 99.9 /100 | #56 | Exceptional 77.1% |
| Chippewa | 99.9 /100 | #57 | Exceptional 77.1% |
| Hawaiians | 99.9 /100 | #58 | Exceptional 77.0% |
| Scotch-Irish | 99.9 /100 | #59 | Exceptional 77.0% |