Immigrants from Italy vs Laotian In Labor Force | Age 20-24
COMPARE
Immigrants from Italy
Laotian
In Labor Force | Age 20-24
In Labor Force | Age 20-24 Comparison
Immigrants from Italy
Laotians
74.6%
IN LABOR FORCE | AGE 20-24
17.6/ 100
METRIC RATING
204th/ 347
METRIC RANK
74.1%
IN LABOR FORCE | AGE 20-24
3.5/ 100
METRIC RATING
235th/ 347
METRIC RANK
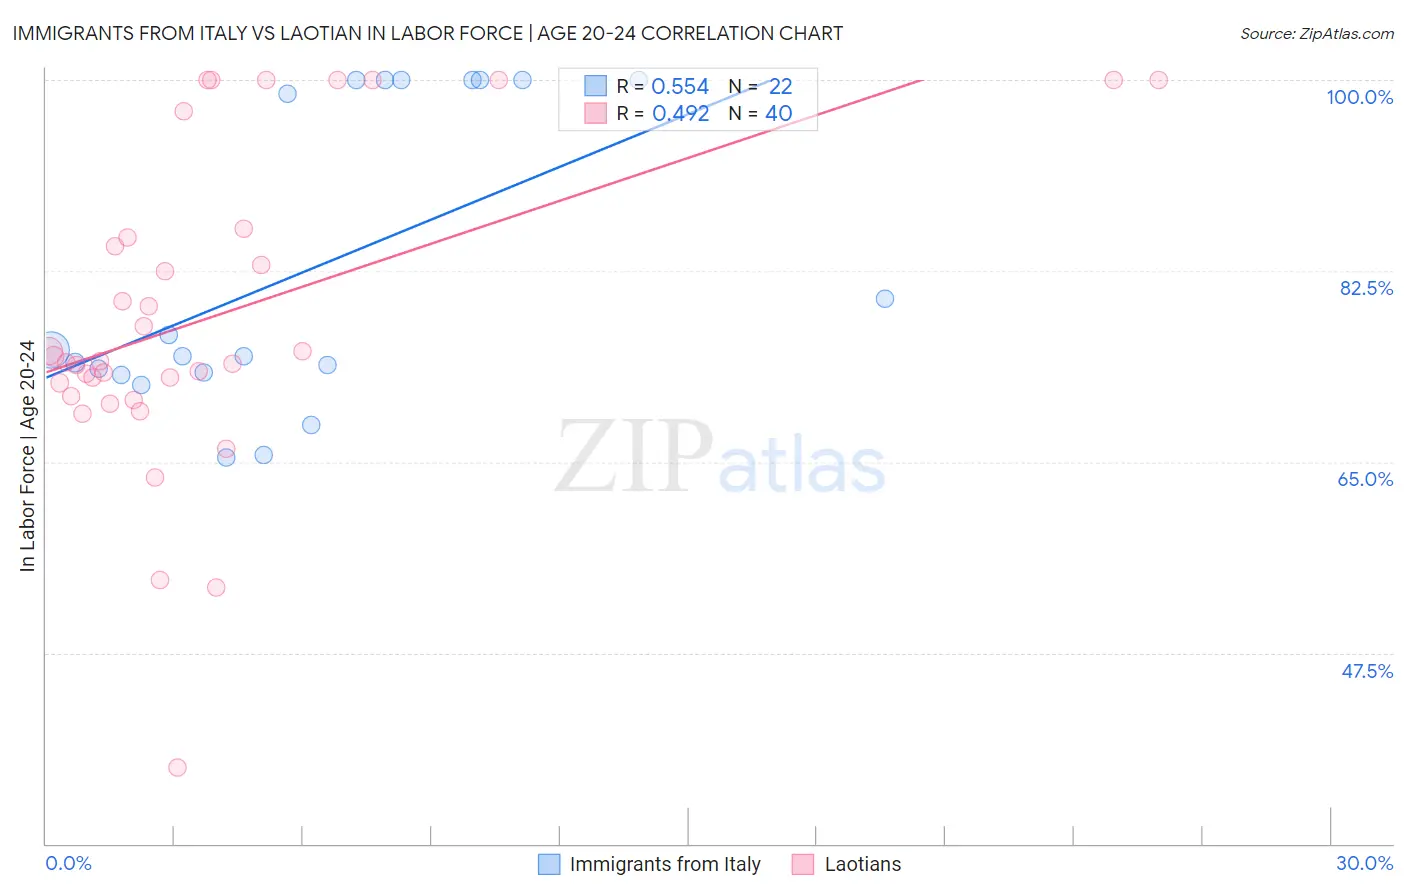
Immigrants from Italy vs Laotian In Labor Force | Age 20-24 Correlation Chart
The statistical analysis conducted on geographies consisting of 324,060,092 people shows a substantial positive correlation between the proportion of Immigrants from Italy and labor force participation rate among population between the ages 20 and 24 in the United States with a correlation coefficient (R) of 0.554 and weighted average of 74.6%. Similarly, the statistical analysis conducted on geographies consisting of 224,808,189 people shows a moderate positive correlation between the proportion of Laotians and labor force participation rate among population between the ages 20 and 24 in the United States with a correlation coefficient (R) of 0.492 and weighted average of 74.1%, a difference of 0.66%.
In Labor Force | Age 20-24 Correlation Summary
| Measurement | Immigrants from Italy | Laotian |
| Minimum | 65.4% | 37.0% |
| Maximum | 100.0% | 100.0% |
| Range | 34.6% | 63.0% |
| Mean | 82.7% | 78.5% |
| Median | 75.0% | 74.4% |
| Interquartile 25% (IQ1) | 73.2% | 71.6% |
| Interquartile 75% (IQ3) | 100.0% | 85.9% |
| Interquartile Range (IQR) | 26.8% | 14.3% |
| Standard Deviation (Sample) | 13.6% | 14.5% |
| Standard Deviation (Population) | 13.3% | 14.3% |
Similar Demographics by In Labor Force | Age 20-24
Demographics Similar to Immigrants from Italy by In Labor Force | Age 20-24
In terms of in labor force | age 20-24, the demographic groups most similar to Immigrants from Italy are Inupiat (74.6%, a difference of 0.0%), Sioux (74.6%, a difference of 0.0%), Immigrants from Northern Africa (74.6%, a difference of 0.010%), Albanian (74.6%, a difference of 0.040%), and Immigrants from Uruguay (74.6%, a difference of 0.050%).
| Demographics | Rating | Rank | In Labor Force | Age 20-24 |
| Panamanians | 25.0 /100 | #197 | Fair 74.7% |
| Immigrants | Nigeria | 24.2 /100 | #198 | Fair 74.7% |
| Taiwanese | 23.2 /100 | #199 | Fair 74.7% |
| Nigerians | 21.9 /100 | #200 | Fair 74.7% |
| Choctaw | 21.4 /100 | #201 | Fair 74.7% |
| Moroccans | 20.4 /100 | #202 | Fair 74.7% |
| Immigrants | Northern Africa | 17.9 /100 | #203 | Poor 74.6% |
| Immigrants | Italy | 17.6 /100 | #204 | Poor 74.6% |
| Inupiat | 17.6 /100 | #205 | Poor 74.6% |
| Sioux | 17.5 /100 | #206 | Poor 74.6% |
| Albanians | 16.2 /100 | #207 | Poor 74.6% |
| Immigrants | Uruguay | 15.8 /100 | #208 | Poor 74.6% |
| Arabs | 15.8 /100 | #209 | Poor 74.6% |
| Uruguayans | 15.1 /100 | #210 | Poor 74.6% |
| Immigrants | Australia | 14.7 /100 | #211 | Poor 74.6% |
Demographics Similar to Laotians by In Labor Force | Age 20-24
In terms of in labor force | age 20-24, the demographic groups most similar to Laotians are Immigrants (74.1%, a difference of 0.010%), Immigrants from Chile (74.1%, a difference of 0.020%), Immigrants from France (74.1%, a difference of 0.020%), Bermudan (74.1%, a difference of 0.030%), and Immigrants from Switzerland (74.2%, a difference of 0.060%).
| Demographics | Rating | Rank | In Labor Force | Age 20-24 |
| Immigrants | Ukraine | 5.1 /100 | #228 | Tragic 74.2% |
| Immigrants | Sweden | 4.6 /100 | #229 | Tragic 74.2% |
| Immigrants | Albania | 4.3 /100 | #230 | Tragic 74.2% |
| Immigrants | Greece | 4.1 /100 | #231 | Tragic 74.2% |
| Immigrants | Switzerland | 4.1 /100 | #232 | Tragic 74.2% |
| Immigrants | Chile | 3.7 /100 | #233 | Tragic 74.1% |
| Immigrants | Immigrants | 3.6 /100 | #234 | Tragic 74.1% |
| Laotians | 3.5 /100 | #235 | Tragic 74.1% |
| Immigrants | France | 3.3 /100 | #236 | Tragic 74.1% |
| Bermudans | 3.2 /100 | #237 | Tragic 74.1% |
| Immigrants | Japan | 3.0 /100 | #238 | Tragic 74.1% |
| Immigrants | Latin America | 2.7 /100 | #239 | Tragic 74.1% |
| Immigrants | Sri Lanka | 2.3 /100 | #240 | Tragic 74.0% |
| Immigrants | Senegal | 2.1 /100 | #241 | Tragic 74.0% |
| Thais | 2.1 /100 | #242 | Tragic 74.0% |