Immigrants from Israel vs Immigrants from Honduras In Labor Force | Age 20-24
COMPARE
Immigrants from Israel
Immigrants from Honduras
In Labor Force | Age 20-24
In Labor Force | Age 20-24 Comparison
Immigrants from Israel
Immigrants from Honduras
71.6%
IN LABOR FORCE | AGE 20-24
0.0/ 100
METRIC RATING
319th/ 347
METRIC RANK
74.9%
IN LABOR FORCE | AGE 20-24
33.5/ 100
METRIC RATING
187th/ 347
METRIC RANK
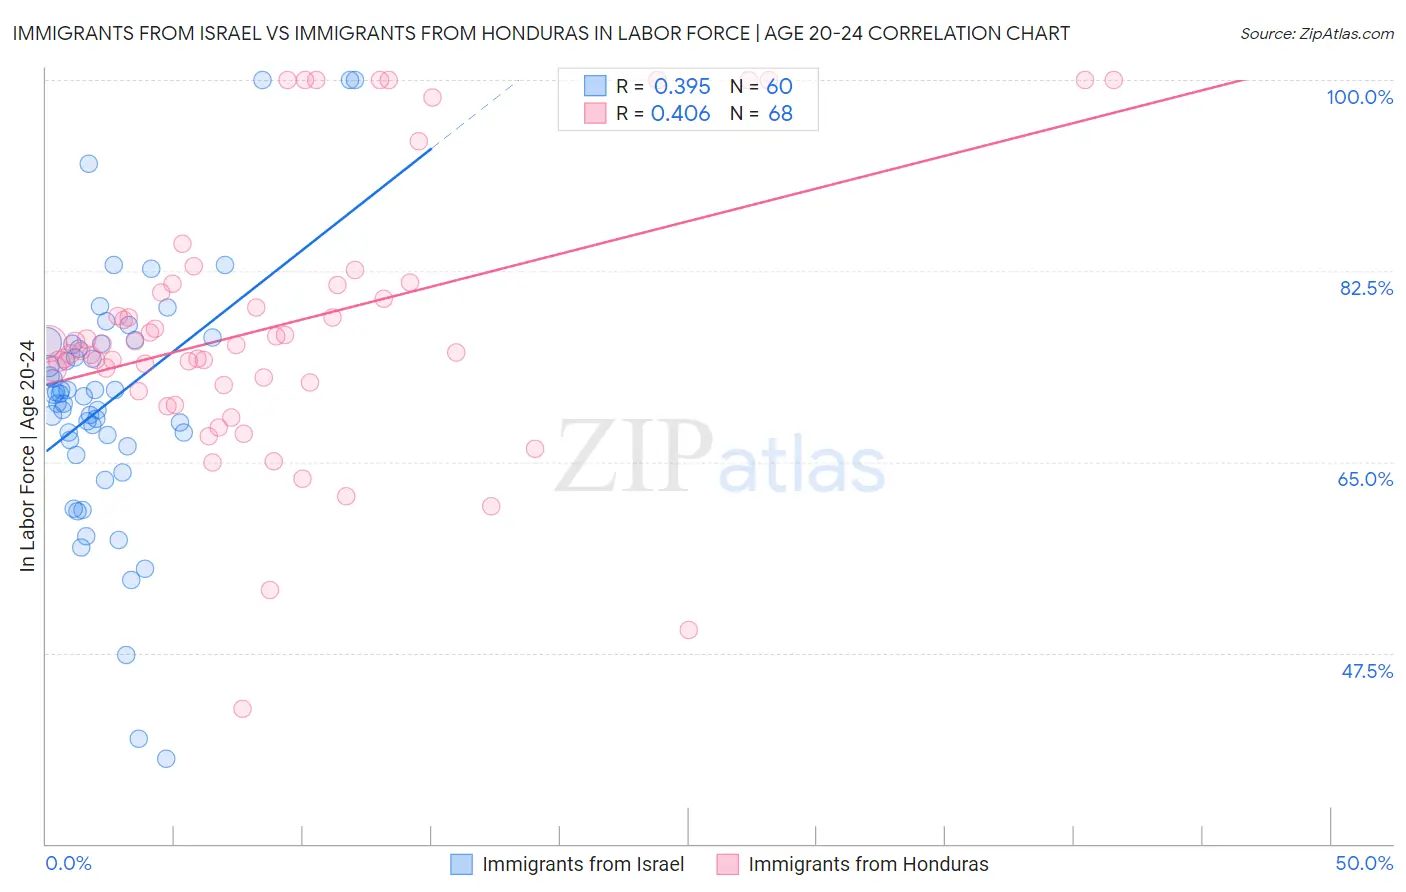
Immigrants from Israel vs Immigrants from Honduras In Labor Force | Age 20-24 Correlation Chart
The statistical analysis conducted on geographies consisting of 209,940,074 people shows a mild positive correlation between the proportion of Immigrants from Israel and labor force participation rate among population between the ages 20 and 24 in the United States with a correlation coefficient (R) of 0.395 and weighted average of 71.6%. Similarly, the statistical analysis conducted on geographies consisting of 322,549,520 people shows a moderate positive correlation between the proportion of Immigrants from Honduras and labor force participation rate among population between the ages 20 and 24 in the United States with a correlation coefficient (R) of 0.406 and weighted average of 74.9%, a difference of 4.6%.
In Labor Force | Age 20-24 Correlation Summary
| Measurement | Immigrants from Israel | Immigrants from Honduras |
| Minimum | 37.8% | 42.4% |
| Maximum | 100.0% | 100.0% |
| Range | 62.2% | 57.6% |
| Mean | 70.6% | 77.5% |
| Median | 71.1% | 75.7% |
| Interquartile 25% (IQ1) | 66.7% | 72.2% |
| Interquartile 75% (IQ3) | 75.8% | 81.3% |
| Interquartile Range (IQR) | 9.1% | 9.1% |
| Standard Deviation (Sample) | 11.7% | 12.5% |
| Standard Deviation (Population) | 11.6% | 12.4% |
Similar Demographics by In Labor Force | Age 20-24
Demographics Similar to Immigrants from Israel by In Labor Force | Age 20-24
In terms of in labor force | age 20-24, the demographic groups most similar to Immigrants from Israel are Immigrants from Hong Kong (71.6%, a difference of 0.030%), Trinidadian and Tobagonian (71.5%, a difference of 0.080%), Immigrants from Armenia (71.7%, a difference of 0.12%), Immigrants from Taiwan (71.5%, a difference of 0.13%), and Filipino (71.4%, a difference of 0.26%).
| Demographics | Rating | Rank | In Labor Force | Age 20-24 |
| Immigrants | Caribbean | 0.0 /100 | #312 | Tragic 71.9% |
| Immigrants | Dominica | 0.0 /100 | #313 | Tragic 71.9% |
| Indians (Asian) | 0.0 /100 | #314 | Tragic 71.9% |
| Immigrants | Iran | 0.0 /100 | #315 | Tragic 71.8% |
| Immigrants | Eastern Asia | 0.0 /100 | #316 | Tragic 71.8% |
| Immigrants | Armenia | 0.0 /100 | #317 | Tragic 71.7% |
| Immigrants | Hong Kong | 0.0 /100 | #318 | Tragic 71.6% |
| Immigrants | Israel | 0.0 /100 | #319 | Tragic 71.6% |
| Trinidadians and Tobagonians | 0.0 /100 | #320 | Tragic 71.5% |
| Immigrants | Taiwan | 0.0 /100 | #321 | Tragic 71.5% |
| Filipinos | 0.0 /100 | #322 | Tragic 71.4% |
| West Indians | 0.0 /100 | #323 | Tragic 71.3% |
| Immigrants | Dominican Republic | 0.0 /100 | #324 | Tragic 71.2% |
| Barbadians | 0.0 /100 | #325 | Tragic 71.1% |
| Dominicans | 0.0 /100 | #326 | Tragic 71.1% |
Demographics Similar to Immigrants from Honduras by In Labor Force | Age 20-24
In terms of in labor force | age 20-24, the demographic groups most similar to Immigrants from Honduras are Immigrants from Eastern Europe (74.9%, a difference of 0.010%), Honduran (74.8%, a difference of 0.010%), Immigrants from Northern Europe (74.8%, a difference of 0.010%), Immigrants from Hungary (74.9%, a difference of 0.020%), and Sri Lankan (74.9%, a difference of 0.020%).
| Demographics | Rating | Rank | In Labor Force | Age 20-24 |
| Immigrants | Czechoslovakia | 44.0 /100 | #180 | Average 75.0% |
| Africans | 42.5 /100 | #181 | Average 75.0% |
| Immigrants | South Africa | 36.9 /100 | #182 | Fair 74.9% |
| Immigrants | Costa Rica | 36.7 /100 | #183 | Fair 74.9% |
| Immigrants | Hungary | 35.0 /100 | #184 | Fair 74.9% |
| Sri Lankans | 34.9 /100 | #185 | Fair 74.9% |
| Immigrants | Eastern Europe | 33.8 /100 | #186 | Fair 74.9% |
| Immigrants | Honduras | 33.5 /100 | #187 | Fair 74.9% |
| Hondurans | 32.7 /100 | #188 | Fair 74.8% |
| Immigrants | Northern Europe | 32.6 /100 | #189 | Fair 74.8% |
| Russians | 32.2 /100 | #190 | Fair 74.8% |
| Senegalese | 28.1 /100 | #191 | Fair 74.8% |
| Immigrants | Europe | 27.5 /100 | #192 | Fair 74.8% |
| Alsatians | 27.1 /100 | #193 | Fair 74.8% |
| Immigrants | Denmark | 25.8 /100 | #194 | Fair 74.8% |