Immigrants from Germany vs Immigrants from Honduras In Labor Force | Age 20-24
COMPARE
Immigrants from Germany
Immigrants from Honduras
In Labor Force | Age 20-24
In Labor Force | Age 20-24 Comparison
Immigrants from Germany
Immigrants from Honduras
76.2%
IN LABOR FORCE | AGE 20-24
98.5/ 100
METRIC RATING
95th/ 347
METRIC RANK
74.9%
IN LABOR FORCE | AGE 20-24
33.5/ 100
METRIC RATING
187th/ 347
METRIC RANK
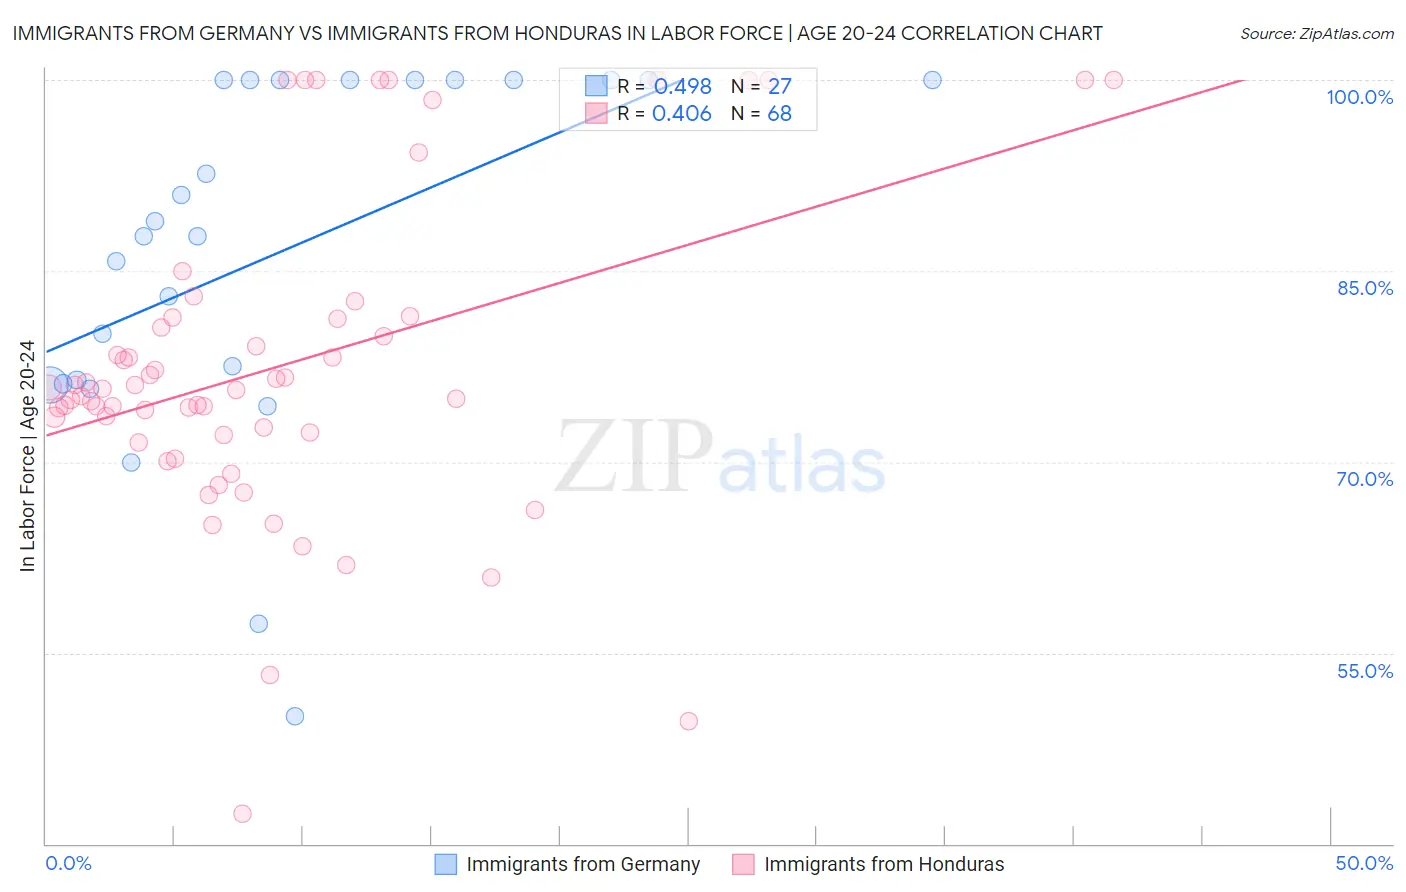
Immigrants from Germany vs Immigrants from Honduras In Labor Force | Age 20-24 Correlation Chart
The statistical analysis conducted on geographies consisting of 463,533,705 people shows a moderate positive correlation between the proportion of Immigrants from Germany and labor force participation rate among population between the ages 20 and 24 in the United States with a correlation coefficient (R) of 0.498 and weighted average of 76.2%. Similarly, the statistical analysis conducted on geographies consisting of 322,549,520 people shows a moderate positive correlation between the proportion of Immigrants from Honduras and labor force participation rate among population between the ages 20 and 24 in the United States with a correlation coefficient (R) of 0.406 and weighted average of 74.9%, a difference of 1.8%.
In Labor Force | Age 20-24 Correlation Summary
| Measurement | Immigrants from Germany | Immigrants from Honduras |
| Minimum | 50.0% | 42.4% |
| Maximum | 100.0% | 100.0% |
| Range | 50.0% | 57.6% |
| Mean | 86.3% | 77.5% |
| Median | 87.8% | 75.7% |
| Interquartile 25% (IQ1) | 76.1% | 72.2% |
| Interquartile 75% (IQ3) | 100.0% | 81.3% |
| Interquartile Range (IQR) | 23.9% | 9.1% |
| Standard Deviation (Sample) | 14.0% | 12.5% |
| Standard Deviation (Population) | 13.7% | 12.4% |
Similar Demographics by In Labor Force | Age 20-24
Demographics Similar to Immigrants from Germany by In Labor Force | Age 20-24
In terms of in labor force | age 20-24, the demographic groups most similar to Immigrants from Germany are Potawatomi (76.2%, a difference of 0.0%), Nonimmigrants (76.2%, a difference of 0.010%), Hungarian (76.3%, a difference of 0.10%), Immigrants from Lithuania (76.1%, a difference of 0.11%), and Immigrants from Oceania (76.1%, a difference of 0.11%).
| Demographics | Rating | Rank | In Labor Force | Age 20-24 |
| Spanish | 99.2 /100 | #88 | Exceptional 76.4% |
| Bulgarians | 99.2 /100 | #89 | Exceptional 76.4% |
| Immigrants | Burma/Myanmar | 99.1 /100 | #90 | Exceptional 76.3% |
| Sierra Leoneans | 99.0 /100 | #91 | Exceptional 76.3% |
| Maltese | 98.9 /100 | #92 | Exceptional 76.3% |
| Hungarians | 98.9 /100 | #93 | Exceptional 76.3% |
| Potawatomi | 98.5 /100 | #94 | Exceptional 76.2% |
| Immigrants | Germany | 98.5 /100 | #95 | Exceptional 76.2% |
| Immigrants | Nonimmigrants | 98.5 /100 | #96 | Exceptional 76.2% |
| Immigrants | Lithuania | 98.0 /100 | #97 | Exceptional 76.1% |
| Immigrants | Oceania | 98.0 /100 | #98 | Exceptional 76.1% |
| Americans | 97.8 /100 | #99 | Exceptional 76.1% |
| Shoshone | 97.8 /100 | #100 | Exceptional 76.1% |
| Immigrants | Poland | 97.7 /100 | #101 | Exceptional 76.1% |
| Latvians | 97.6 /100 | #102 | Exceptional 76.1% |
Demographics Similar to Immigrants from Honduras by In Labor Force | Age 20-24
In terms of in labor force | age 20-24, the demographic groups most similar to Immigrants from Honduras are Immigrants from Eastern Europe (74.9%, a difference of 0.010%), Honduran (74.8%, a difference of 0.010%), Immigrants from Northern Europe (74.8%, a difference of 0.010%), Immigrants from Hungary (74.9%, a difference of 0.020%), and Sri Lankan (74.9%, a difference of 0.020%).
| Demographics | Rating | Rank | In Labor Force | Age 20-24 |
| Immigrants | Czechoslovakia | 44.0 /100 | #180 | Average 75.0% |
| Africans | 42.5 /100 | #181 | Average 75.0% |
| Immigrants | South Africa | 36.9 /100 | #182 | Fair 74.9% |
| Immigrants | Costa Rica | 36.7 /100 | #183 | Fair 74.9% |
| Immigrants | Hungary | 35.0 /100 | #184 | Fair 74.9% |
| Sri Lankans | 34.9 /100 | #185 | Fair 74.9% |
| Immigrants | Eastern Europe | 33.8 /100 | #186 | Fair 74.9% |
| Immigrants | Honduras | 33.5 /100 | #187 | Fair 74.9% |
| Hondurans | 32.7 /100 | #188 | Fair 74.8% |
| Immigrants | Northern Europe | 32.6 /100 | #189 | Fair 74.8% |
| Russians | 32.2 /100 | #190 | Fair 74.8% |
| Senegalese | 28.1 /100 | #191 | Fair 74.8% |
| Immigrants | Europe | 27.5 /100 | #192 | Fair 74.8% |
| Alsatians | 27.1 /100 | #193 | Fair 74.8% |
| Immigrants | Denmark | 25.8 /100 | #194 | Fair 74.8% |