Immigrants from Israel vs Potawatomi In Labor Force | Age 20-24
COMPARE
Immigrants from Israel
Potawatomi
In Labor Force | Age 20-24
In Labor Force | Age 20-24 Comparison
Immigrants from Israel
Potawatomi
71.6%
IN LABOR FORCE | AGE 20-24
0.0/ 100
METRIC RATING
319th/ 347
METRIC RANK
76.2%
IN LABOR FORCE | AGE 20-24
98.5/ 100
METRIC RATING
94th/ 347
METRIC RANK
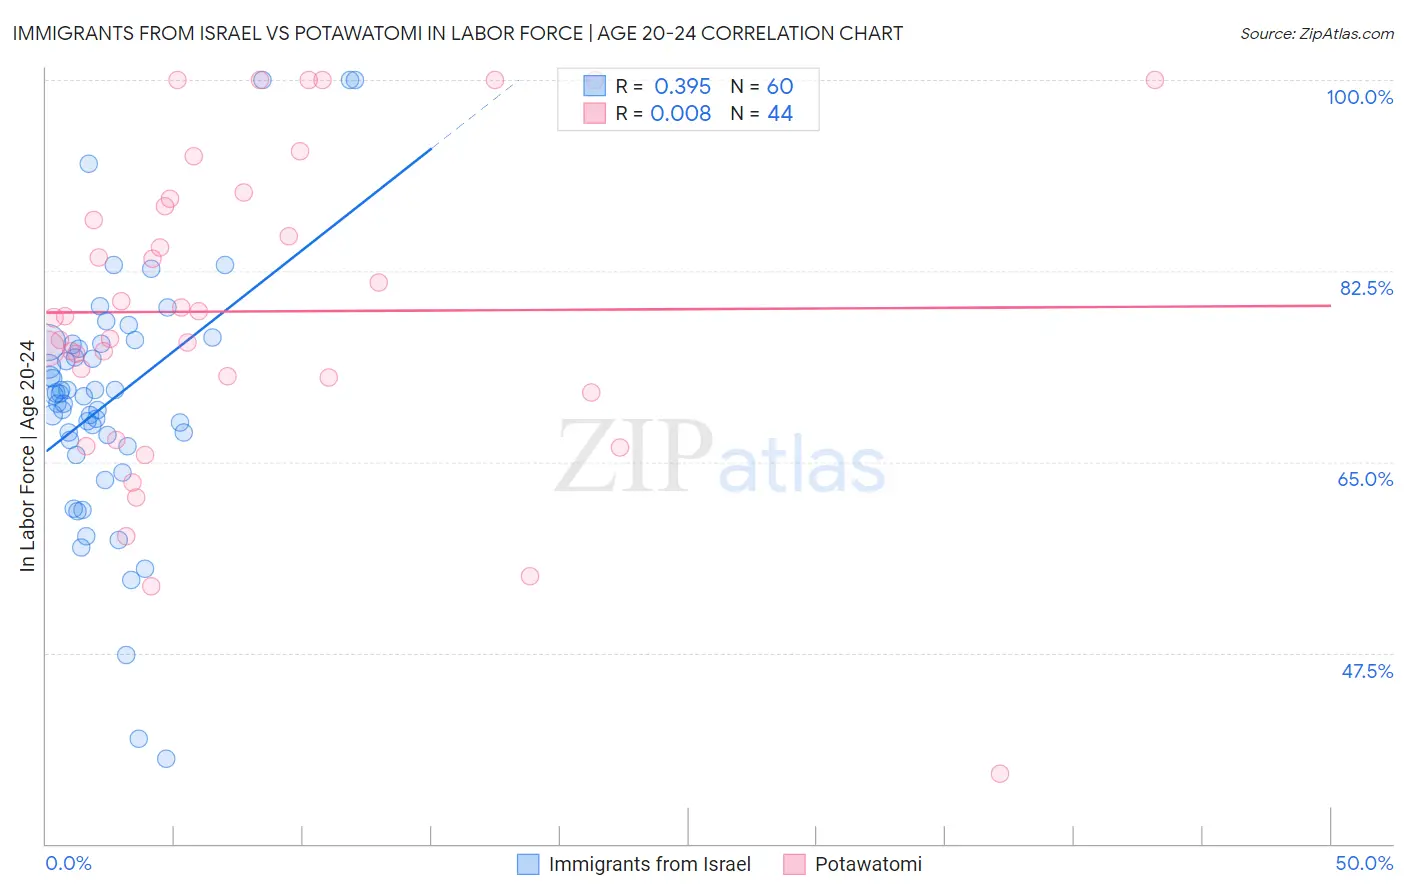
Immigrants from Israel vs Potawatomi In Labor Force | Age 20-24 Correlation Chart
The statistical analysis conducted on geographies consisting of 209,940,074 people shows a mild positive correlation between the proportion of Immigrants from Israel and labor force participation rate among population between the ages 20 and 24 in the United States with a correlation coefficient (R) of 0.395 and weighted average of 71.6%. Similarly, the statistical analysis conducted on geographies consisting of 117,717,222 people shows no correlation between the proportion of Potawatomi and labor force participation rate among population between the ages 20 and 24 in the United States with a correlation coefficient (R) of 0.008 and weighted average of 76.2%, a difference of 6.5%.
In Labor Force | Age 20-24 Correlation Summary
| Measurement | Immigrants from Israel | Potawatomi |
| Minimum | 37.8% | 36.4% |
| Maximum | 100.0% | 100.0% |
| Range | 62.2% | 63.6% |
| Mean | 70.6% | 78.8% |
| Median | 71.1% | 78.3% |
| Interquartile 25% (IQ1) | 66.7% | 72.0% |
| Interquartile 75% (IQ3) | 75.8% | 88.8% |
| Interquartile Range (IQR) | 9.1% | 16.7% |
| Standard Deviation (Sample) | 11.7% | 14.4% |
| Standard Deviation (Population) | 11.6% | 14.2% |
Similar Demographics by In Labor Force | Age 20-24
Demographics Similar to Immigrants from Israel by In Labor Force | Age 20-24
In terms of in labor force | age 20-24, the demographic groups most similar to Immigrants from Israel are Immigrants from Hong Kong (71.6%, a difference of 0.030%), Trinidadian and Tobagonian (71.5%, a difference of 0.080%), Immigrants from Armenia (71.7%, a difference of 0.12%), Immigrants from Taiwan (71.5%, a difference of 0.13%), and Filipino (71.4%, a difference of 0.26%).
| Demographics | Rating | Rank | In Labor Force | Age 20-24 |
| Immigrants | Caribbean | 0.0 /100 | #312 | Tragic 71.9% |
| Immigrants | Dominica | 0.0 /100 | #313 | Tragic 71.9% |
| Indians (Asian) | 0.0 /100 | #314 | Tragic 71.9% |
| Immigrants | Iran | 0.0 /100 | #315 | Tragic 71.8% |
| Immigrants | Eastern Asia | 0.0 /100 | #316 | Tragic 71.8% |
| Immigrants | Armenia | 0.0 /100 | #317 | Tragic 71.7% |
| Immigrants | Hong Kong | 0.0 /100 | #318 | Tragic 71.6% |
| Immigrants | Israel | 0.0 /100 | #319 | Tragic 71.6% |
| Trinidadians and Tobagonians | 0.0 /100 | #320 | Tragic 71.5% |
| Immigrants | Taiwan | 0.0 /100 | #321 | Tragic 71.5% |
| Filipinos | 0.0 /100 | #322 | Tragic 71.4% |
| West Indians | 0.0 /100 | #323 | Tragic 71.3% |
| Immigrants | Dominican Republic | 0.0 /100 | #324 | Tragic 71.2% |
| Barbadians | 0.0 /100 | #325 | Tragic 71.1% |
| Dominicans | 0.0 /100 | #326 | Tragic 71.1% |
Demographics Similar to Potawatomi by In Labor Force | Age 20-24
In terms of in labor force | age 20-24, the demographic groups most similar to Potawatomi are Immigrants from Germany (76.2%, a difference of 0.0%), Nonimmigrants (76.2%, a difference of 0.010%), Hungarian (76.3%, a difference of 0.090%), Maltese (76.3%, a difference of 0.11%), and Immigrants from Lithuania (76.1%, a difference of 0.12%).
| Demographics | Rating | Rank | In Labor Force | Age 20-24 |
| Immigrants | Thailand | 99.3 /100 | #87 | Exceptional 76.4% |
| Spanish | 99.2 /100 | #88 | Exceptional 76.4% |
| Bulgarians | 99.2 /100 | #89 | Exceptional 76.4% |
| Immigrants | Burma/Myanmar | 99.1 /100 | #90 | Exceptional 76.3% |
| Sierra Leoneans | 99.0 /100 | #91 | Exceptional 76.3% |
| Maltese | 98.9 /100 | #92 | Exceptional 76.3% |
| Hungarians | 98.9 /100 | #93 | Exceptional 76.3% |
| Potawatomi | 98.5 /100 | #94 | Exceptional 76.2% |
| Immigrants | Germany | 98.5 /100 | #95 | Exceptional 76.2% |
| Immigrants | Nonimmigrants | 98.5 /100 | #96 | Exceptional 76.2% |
| Immigrants | Lithuania | 98.0 /100 | #97 | Exceptional 76.1% |
| Immigrants | Oceania | 98.0 /100 | #98 | Exceptional 76.1% |
| Americans | 97.8 /100 | #99 | Exceptional 76.1% |
| Shoshone | 97.8 /100 | #100 | Exceptional 76.1% |
| Immigrants | Poland | 97.7 /100 | #101 | Exceptional 76.1% |