Immigrants from Israel vs Immigrants from Honduras Median Family Income
COMPARE
Immigrants from Israel
Immigrants from Honduras
Median Family Income
Median Family Income Comparison
Immigrants from Israel
Immigrants from Honduras
$127,430
MEDIAN FAMILY INCOME
100.0/ 100
METRIC RATING
11th/ 347
METRIC RANK
$83,618
MEDIAN FAMILY INCOME
0.0/ 100
METRIC RATING
319th/ 347
METRIC RANK
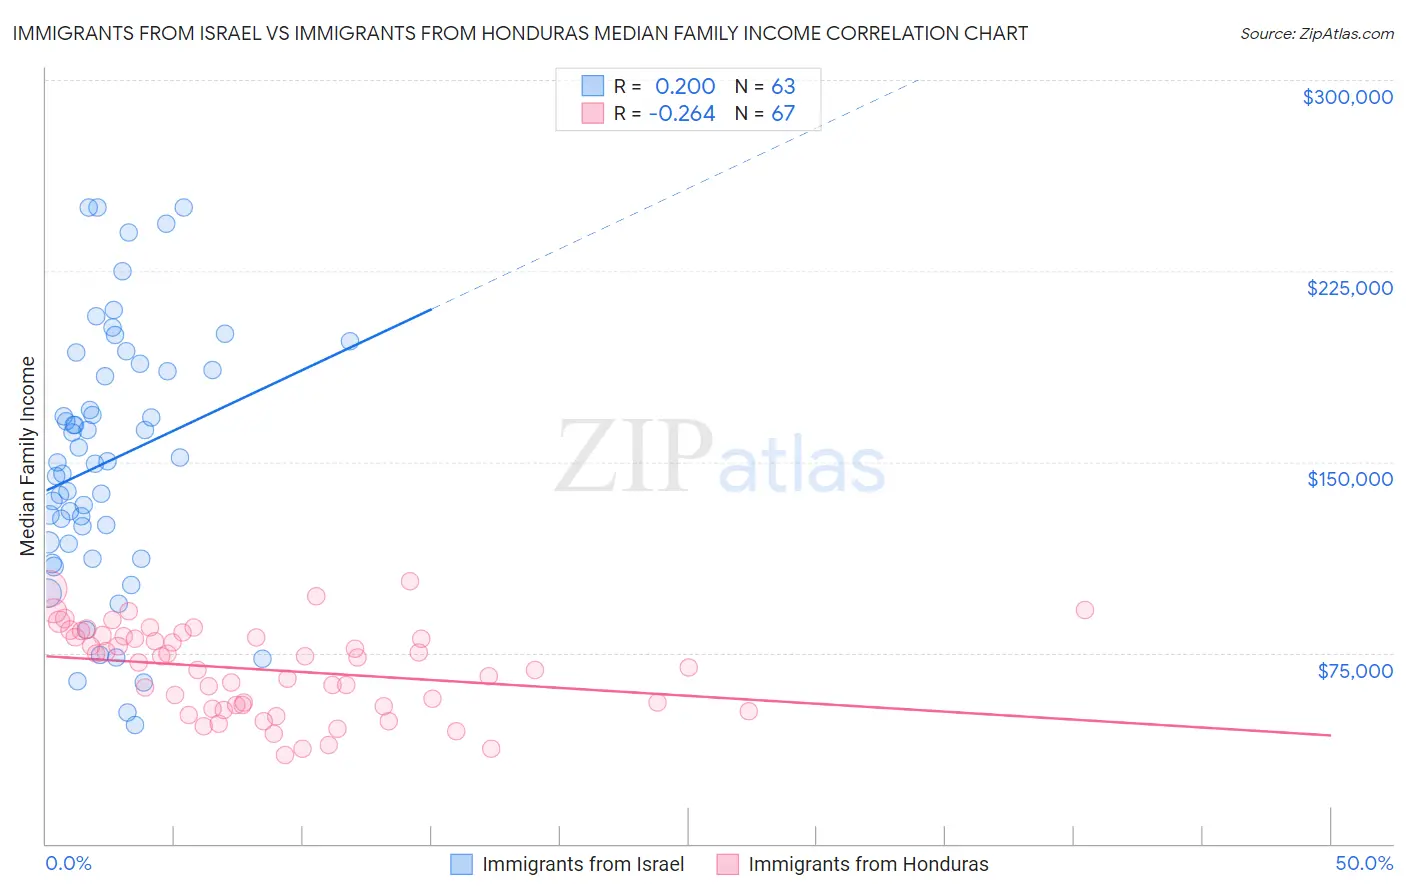
Immigrants from Israel vs Immigrants from Honduras Median Family Income Correlation Chart
The statistical analysis conducted on geographies consisting of 209,964,659 people shows a weak positive correlation between the proportion of Immigrants from Israel and median family income in the United States with a correlation coefficient (R) of 0.200 and weighted average of $127,430. Similarly, the statistical analysis conducted on geographies consisting of 322,401,068 people shows a weak negative correlation between the proportion of Immigrants from Honduras and median family income in the United States with a correlation coefficient (R) of -0.264 and weighted average of $83,618, a difference of 52.4%.
Median Family Income Correlation Summary
| Measurement | Immigrants from Israel | Immigrants from Honduras |
| Minimum | $46,719 | $34,952 |
| Maximum | $250,001 | $103,059 |
| Range | $203,282 | $68,107 |
| Mean | $150,105 | $68,333 |
| Median | $149,830 | $70,983 |
| Interquartile 25% (IQ1) | $117,916 | $53,890 |
| Interquartile 75% (IQ3) | $185,912 | $81,453 |
| Interquartile Range (IQR) | $67,996 | $27,563 |
| Standard Deviation (Sample) | $50,555 | $17,040 |
| Standard Deviation (Population) | $50,152 | $16,912 |
Similar Demographics by Median Family Income
Demographics Similar to Immigrants from Israel by Median Family Income
In terms of median family income, the demographic groups most similar to Immigrants from Israel are Immigrants from Ireland ($127,584, a difference of 0.12%), Cypriot ($127,064, a difference of 0.29%), Immigrants from Australia ($126,620, a difference of 0.64%), Immigrants from South Central Asia ($125,956, a difference of 1.2%), and Eastern European ($125,546, a difference of 1.5%).
| Demographics | Rating | Rank | Median Family Income |
| Immigrants | India | 100.0 /100 | #4 | Exceptional $134,028 |
| Iranians | 100.0 /100 | #5 | Exceptional $133,839 |
| Thais | 100.0 /100 | #6 | Exceptional $131,281 |
| Immigrants | Hong Kong | 100.0 /100 | #7 | Exceptional $131,067 |
| Immigrants | Iran | 100.0 /100 | #8 | Exceptional $130,894 |
| Okinawans | 100.0 /100 | #9 | Exceptional $129,979 |
| Immigrants | Ireland | 100.0 /100 | #10 | Exceptional $127,584 |
| Immigrants | Israel | 100.0 /100 | #11 | Exceptional $127,430 |
| Cypriots | 100.0 /100 | #12 | Exceptional $127,064 |
| Immigrants | Australia | 100.0 /100 | #13 | Exceptional $126,620 |
| Immigrants | South Central Asia | 100.0 /100 | #14 | Exceptional $125,956 |
| Eastern Europeans | 100.0 /100 | #15 | Exceptional $125,546 |
| Immigrants | China | 100.0 /100 | #16 | Exceptional $125,540 |
| Indians (Asian) | 100.0 /100 | #17 | Exceptional $125,312 |
| Immigrants | Eastern Asia | 100.0 /100 | #18 | Exceptional $125,150 |
Demographics Similar to Immigrants from Honduras by Median Family Income
In terms of median family income, the demographic groups most similar to Immigrants from Honduras are Immigrants from Mexico ($83,639, a difference of 0.030%), Seminole ($83,354, a difference of 0.32%), Immigrants from Caribbean ($83,319, a difference of 0.36%), Yakama ($83,932, a difference of 0.38%), and Immigrants from Haiti ($84,018, a difference of 0.48%).
| Demographics | Rating | Rank | Median Family Income |
| Cubans | 0.0 /100 | #312 | Tragic $84,981 |
| Choctaw | 0.0 /100 | #313 | Tragic $84,835 |
| Immigrants | Bahamas | 0.0 /100 | #314 | Tragic $84,732 |
| Apache | 0.0 /100 | #315 | Tragic $84,451 |
| Immigrants | Haiti | 0.0 /100 | #316 | Tragic $84,018 |
| Yakama | 0.0 /100 | #317 | Tragic $83,932 |
| Immigrants | Mexico | 0.0 /100 | #318 | Tragic $83,639 |
| Immigrants | Honduras | 0.0 /100 | #319 | Tragic $83,618 |
| Seminole | 0.0 /100 | #320 | Tragic $83,354 |
| Immigrants | Caribbean | 0.0 /100 | #321 | Tragic $83,319 |
| Dominicans | 0.0 /100 | #322 | Tragic $82,888 |
| Bahamians | 0.0 /100 | #323 | Tragic $82,631 |
| Creek | 0.0 /100 | #324 | Tragic $82,560 |
| Sioux | 0.0 /100 | #325 | Tragic $82,386 |
| Immigrants | Congo | 0.0 /100 | #326 | Tragic $82,216 |