Aleut vs Immigrants from Honduras In Labor Force | Age 20-24
COMPARE
Aleut
Immigrants from Honduras
In Labor Force | Age 20-24
In Labor Force | Age 20-24 Comparison
Aleuts
Immigrants from Honduras
79.0%
IN LABOR FORCE | AGE 20-24
100.0/ 100
METRIC RATING
5th/ 347
METRIC RANK
74.9%
IN LABOR FORCE | AGE 20-24
33.5/ 100
METRIC RATING
187th/ 347
METRIC RANK
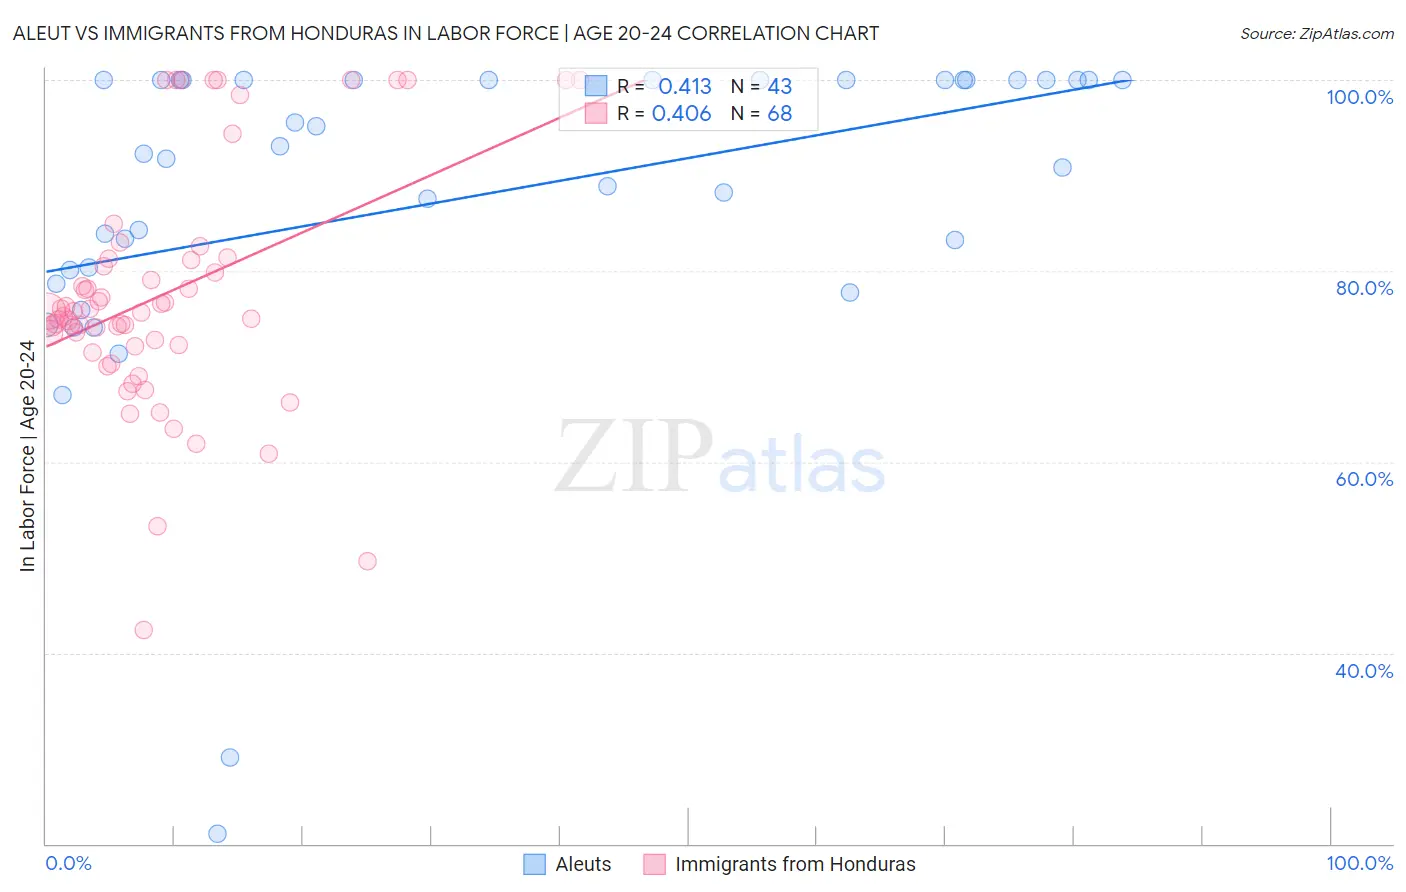
Aleut vs Immigrants from Honduras In Labor Force | Age 20-24 Correlation Chart
The statistical analysis conducted on geographies consisting of 61,769,180 people shows a moderate positive correlation between the proportion of Aleuts and labor force participation rate among population between the ages 20 and 24 in the United States with a correlation coefficient (R) of 0.413 and weighted average of 79.0%. Similarly, the statistical analysis conducted on geographies consisting of 322,549,520 people shows a moderate positive correlation between the proportion of Immigrants from Honduras and labor force participation rate among population between the ages 20 and 24 in the United States with a correlation coefficient (R) of 0.406 and weighted average of 74.9%, a difference of 5.5%.
In Labor Force | Age 20-24 Correlation Summary
| Measurement | Aleut | Immigrants from Honduras |
| Minimum | 21.1% | 42.4% |
| Maximum | 100.0% | 100.0% |
| Range | 78.9% | 57.6% |
| Mean | 87.5% | 77.5% |
| Median | 92.3% | 75.7% |
| Interquartile 25% (IQ1) | 80.1% | 72.2% |
| Interquartile 75% (IQ3) | 100.0% | 81.3% |
| Interquartile Range (IQR) | 19.9% | 9.1% |
| Standard Deviation (Sample) | 17.3% | 12.5% |
| Standard Deviation (Population) | 17.1% | 12.4% |
Similar Demographics by In Labor Force | Age 20-24
Demographics Similar to Aleuts by In Labor Force | Age 20-24
In terms of in labor force | age 20-24, the demographic groups most similar to Aleuts are Danish (79.0%, a difference of 0.010%), Luxembourger (79.0%, a difference of 0.050%), Alaskan Athabascan (79.1%, a difference of 0.14%), Immigrants from Cabo Verde (78.9%, a difference of 0.16%), and Swedish (78.8%, a difference of 0.22%).
| Demographics | Rating | Rank | In Labor Force | Age 20-24 |
| Norwegians | 100.0 /100 | #1 | Exceptional 80.1% |
| Immigrants | Somalia | 100.0 /100 | #2 | Exceptional 79.5% |
| Somalis | 100.0 /100 | #3 | Exceptional 79.3% |
| Alaskan Athabascans | 100.0 /100 | #4 | Exceptional 79.1% |
| Aleuts | 100.0 /100 | #5 | Exceptional 79.0% |
| Danes | 100.0 /100 | #6 | Exceptional 79.0% |
| Luxembourgers | 100.0 /100 | #7 | Exceptional 79.0% |
| Immigrants | Cabo Verde | 100.0 /100 | #8 | Exceptional 78.9% |
| Swedes | 100.0 /100 | #9 | Exceptional 78.8% |
| Slovenes | 100.0 /100 | #10 | Exceptional 78.7% |
| Finns | 100.0 /100 | #11 | Exceptional 78.7% |
| Germans | 100.0 /100 | #12 | Exceptional 78.6% |
| Scandinavians | 100.0 /100 | #13 | Exceptional 78.5% |
| Czechs | 100.0 /100 | #14 | Exceptional 78.5% |
| Sudanese | 100.0 /100 | #15 | Exceptional 78.4% |
Demographics Similar to Immigrants from Honduras by In Labor Force | Age 20-24
In terms of in labor force | age 20-24, the demographic groups most similar to Immigrants from Honduras are Immigrants from Eastern Europe (74.9%, a difference of 0.010%), Honduran (74.8%, a difference of 0.010%), Immigrants from Northern Europe (74.8%, a difference of 0.010%), Immigrants from Hungary (74.9%, a difference of 0.020%), and Sri Lankan (74.9%, a difference of 0.020%).
| Demographics | Rating | Rank | In Labor Force | Age 20-24 |
| Immigrants | Czechoslovakia | 44.0 /100 | #180 | Average 75.0% |
| Africans | 42.5 /100 | #181 | Average 75.0% |
| Immigrants | South Africa | 36.9 /100 | #182 | Fair 74.9% |
| Immigrants | Costa Rica | 36.7 /100 | #183 | Fair 74.9% |
| Immigrants | Hungary | 35.0 /100 | #184 | Fair 74.9% |
| Sri Lankans | 34.9 /100 | #185 | Fair 74.9% |
| Immigrants | Eastern Europe | 33.8 /100 | #186 | Fair 74.9% |
| Immigrants | Honduras | 33.5 /100 | #187 | Fair 74.9% |
| Hondurans | 32.7 /100 | #188 | Fair 74.8% |
| Immigrants | Northern Europe | 32.6 /100 | #189 | Fair 74.8% |
| Russians | 32.2 /100 | #190 | Fair 74.8% |
| Senegalese | 28.1 /100 | #191 | Fair 74.8% |
| Immigrants | Europe | 27.5 /100 | #192 | Fair 74.8% |
| Alsatians | 27.1 /100 | #193 | Fair 74.8% |
| Immigrants | Denmark | 25.8 /100 | #194 | Fair 74.8% |