Immigrants from Israel vs Immigrants from Eritrea In Labor Force | Age 20-24
COMPARE
Immigrants from Israel
Immigrants from Eritrea
In Labor Force | Age 20-24
In Labor Force | Age 20-24 Comparison
Immigrants from Israel
Immigrants from Eritrea
71.6%
IN LABOR FORCE | AGE 20-24
0.0/ 100
METRIC RATING
319th/ 347
METRIC RANK
77.0%
IN LABOR FORCE | AGE 20-24
99.9/ 100
METRIC RATING
61st/ 347
METRIC RANK
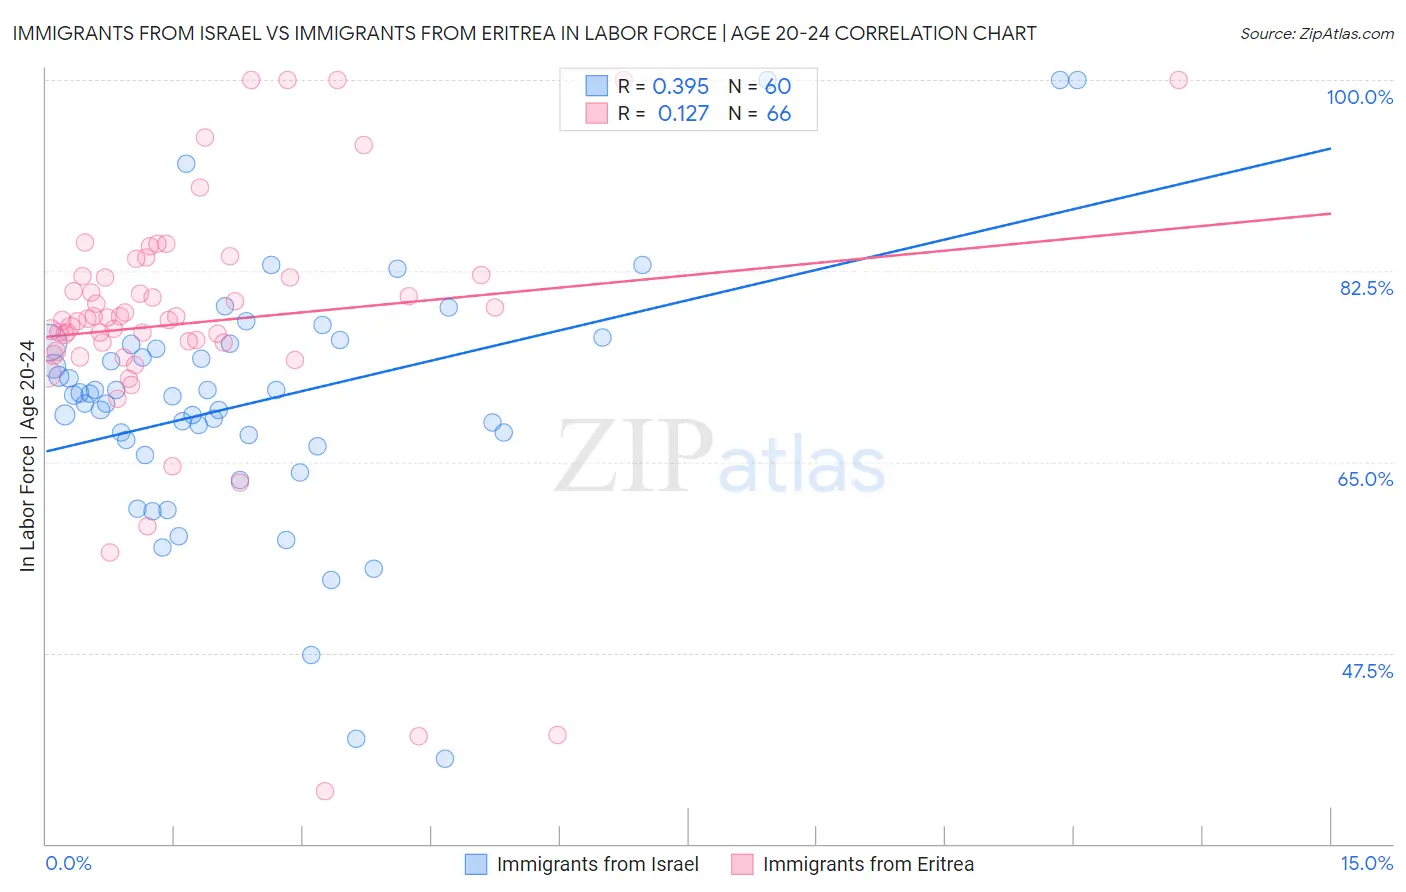
Immigrants from Israel vs Immigrants from Eritrea In Labor Force | Age 20-24 Correlation Chart
The statistical analysis conducted on geographies consisting of 209,940,074 people shows a mild positive correlation between the proportion of Immigrants from Israel and labor force participation rate among population between the ages 20 and 24 in the United States with a correlation coefficient (R) of 0.395 and weighted average of 71.6%. Similarly, the statistical analysis conducted on geographies consisting of 104,852,788 people shows a poor positive correlation between the proportion of Immigrants from Eritrea and labor force participation rate among population between the ages 20 and 24 in the United States with a correlation coefficient (R) of 0.127 and weighted average of 77.0%, a difference of 7.5%.
In Labor Force | Age 20-24 Correlation Summary
| Measurement | Immigrants from Israel | Immigrants from Eritrea |
| Minimum | 37.8% | 34.8% |
| Maximum | 100.0% | 100.0% |
| Range | 62.2% | 65.2% |
| Mean | 70.6% | 77.8% |
| Median | 71.1% | 78.0% |
| Interquartile 25% (IQ1) | 66.7% | 75.1% |
| Interquartile 75% (IQ3) | 75.8% | 82.1% |
| Interquartile Range (IQR) | 9.1% | 6.9% |
| Standard Deviation (Sample) | 11.7% | 12.2% |
| Standard Deviation (Population) | 11.6% | 12.1% |
Similar Demographics by In Labor Force | Age 20-24
Demographics Similar to Immigrants from Israel by In Labor Force | Age 20-24
In terms of in labor force | age 20-24, the demographic groups most similar to Immigrants from Israel are Immigrants from Hong Kong (71.6%, a difference of 0.030%), Trinidadian and Tobagonian (71.5%, a difference of 0.080%), Immigrants from Armenia (71.7%, a difference of 0.12%), Immigrants from Taiwan (71.5%, a difference of 0.13%), and Filipino (71.4%, a difference of 0.26%).
| Demographics | Rating | Rank | In Labor Force | Age 20-24 |
| Immigrants | Caribbean | 0.0 /100 | #312 | Tragic 71.9% |
| Immigrants | Dominica | 0.0 /100 | #313 | Tragic 71.9% |
| Indians (Asian) | 0.0 /100 | #314 | Tragic 71.9% |
| Immigrants | Iran | 0.0 /100 | #315 | Tragic 71.8% |
| Immigrants | Eastern Asia | 0.0 /100 | #316 | Tragic 71.8% |
| Immigrants | Armenia | 0.0 /100 | #317 | Tragic 71.7% |
| Immigrants | Hong Kong | 0.0 /100 | #318 | Tragic 71.6% |
| Immigrants | Israel | 0.0 /100 | #319 | Tragic 71.6% |
| Trinidadians and Tobagonians | 0.0 /100 | #320 | Tragic 71.5% |
| Immigrants | Taiwan | 0.0 /100 | #321 | Tragic 71.5% |
| Filipinos | 0.0 /100 | #322 | Tragic 71.4% |
| West Indians | 0.0 /100 | #323 | Tragic 71.3% |
| Immigrants | Dominican Republic | 0.0 /100 | #324 | Tragic 71.2% |
| Barbadians | 0.0 /100 | #325 | Tragic 71.1% |
| Dominicans | 0.0 /100 | #326 | Tragic 71.1% |
Demographics Similar to Immigrants from Eritrea by In Labor Force | Age 20-24
In terms of in labor force | age 20-24, the demographic groups most similar to Immigrants from Eritrea are Immigrants from Kenya (77.0%, a difference of 0.010%), Lithuanian (77.0%, a difference of 0.010%), Kenyan (77.0%, a difference of 0.050%), White/Caucasian (76.9%, a difference of 0.050%), and Scotch-Irish (77.0%, a difference of 0.080%).
| Demographics | Rating | Rank | In Labor Force | Age 20-24 |
| Celtics | 99.9 /100 | #54 | Exceptional 77.1% |
| Immigrants | Liberia | 99.9 /100 | #55 | Exceptional 77.1% |
| Europeans | 99.9 /100 | #56 | Exceptional 77.1% |
| Chippewa | 99.9 /100 | #57 | Exceptional 77.1% |
| Hawaiians | 99.9 /100 | #58 | Exceptional 77.0% |
| Scotch-Irish | 99.9 /100 | #59 | Exceptional 77.0% |
| Kenyans | 99.9 /100 | #60 | Exceptional 77.0% |
| Immigrants | Eritrea | 99.9 /100 | #61 | Exceptional 77.0% |
| Immigrants | Kenya | 99.9 /100 | #62 | Exceptional 77.0% |
| Lithuanians | 99.9 /100 | #63 | Exceptional 77.0% |
| Whites/Caucasians | 99.9 /100 | #64 | Exceptional 76.9% |
| Crow | 99.9 /100 | #65 | Exceptional 76.9% |
| Icelanders | 99.9 /100 | #66 | Exceptional 76.9% |
| Slavs | 99.9 /100 | #67 | Exceptional 76.9% |
| French American Indians | 99.8 /100 | #68 | Exceptional 76.8% |