Immigrants from Iraq vs Peruvian In Labor Force | Age > 16
COMPARE
Immigrants from Iraq
Peruvian
In Labor Force | Age > 16
In Labor Force | Age > 16 Comparison
Immigrants from Iraq
Peruvians
65.7%
IN LABOR FORCE | AGE > 16
95.5/ 100
METRIC RATING
123rd/ 347
METRIC RANK
66.3%
IN LABOR FORCE | AGE > 16
99.8/ 100
METRIC RATING
64th/ 347
METRIC RANK
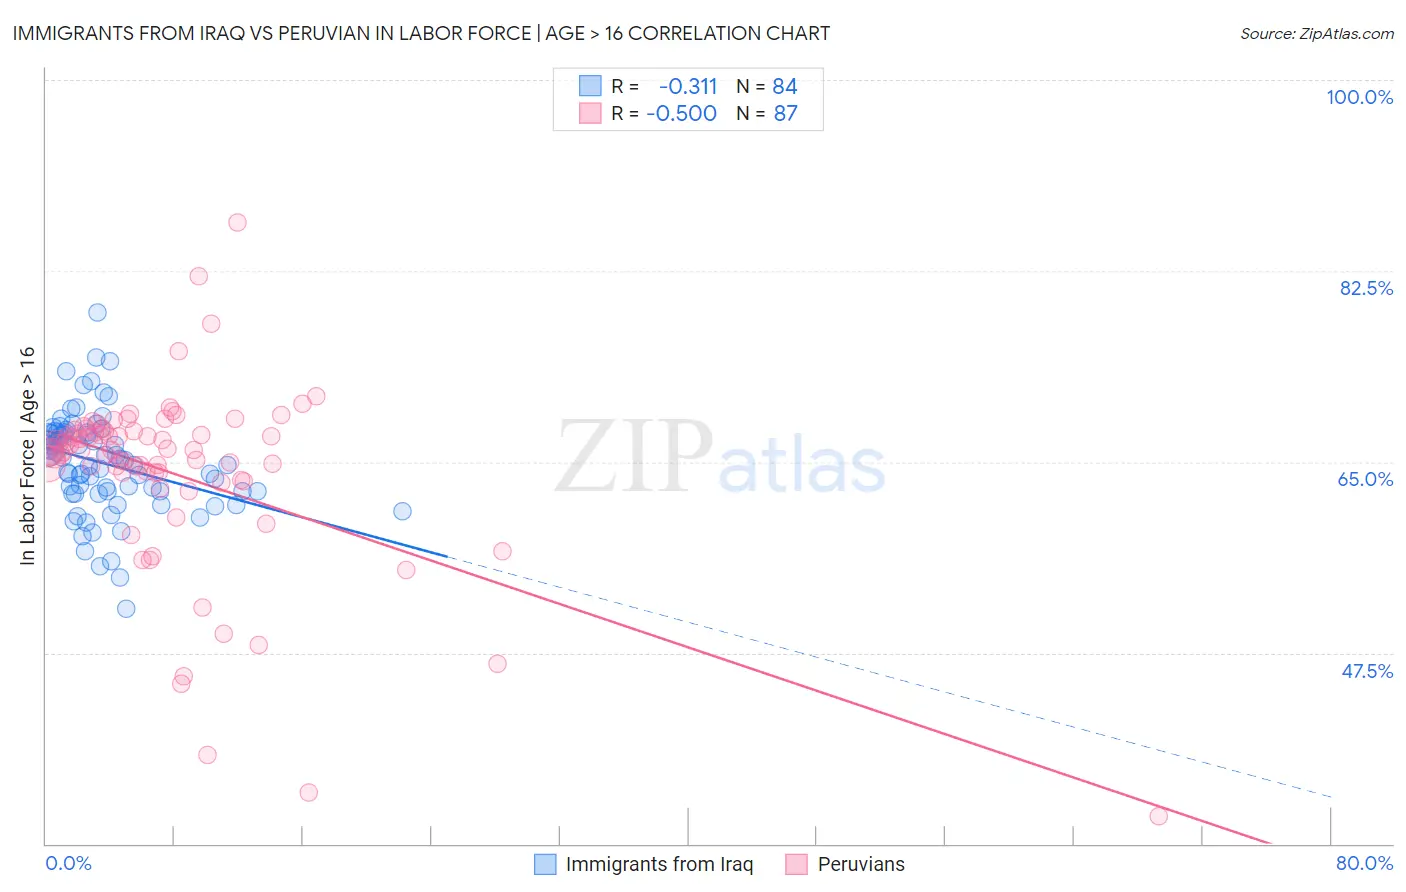
Immigrants from Iraq vs Peruvian In Labor Force | Age > 16 Correlation Chart
The statistical analysis conducted on geographies consisting of 194,783,152 people shows a mild negative correlation between the proportion of Immigrants from Iraq and labor force participation rate among population ages 16 and over in the United States with a correlation coefficient (R) of -0.311 and weighted average of 65.7%. Similarly, the statistical analysis conducted on geographies consisting of 363,253,331 people shows a moderate negative correlation between the proportion of Peruvians and labor force participation rate among population ages 16 and over in the United States with a correlation coefficient (R) of -0.500 and weighted average of 66.3%, a difference of 0.92%.
In Labor Force | Age > 16 Correlation Summary
| Measurement | Immigrants from Iraq | Peruvian |
| Minimum | 51.5% | 32.5% |
| Maximum | 78.7% | 86.9% |
| Range | 27.2% | 54.4% |
| Mean | 64.8% | 64.0% |
| Median | 64.9% | 66.1% |
| Interquartile 25% (IQ1) | 62.2% | 63.4% |
| Interquartile 75% (IQ3) | 67.7% | 67.8% |
| Interquartile Range (IQR) | 5.5% | 4.4% |
| Standard Deviation (Sample) | 4.7% | 8.6% |
| Standard Deviation (Population) | 4.7% | 8.6% |
Similar Demographics by In Labor Force | Age > 16
Demographics Similar to Immigrants from Iraq by In Labor Force | Age > 16
In terms of in labor force | age > 16, the demographic groups most similar to Immigrants from Iraq are Iraqi (65.7%, a difference of 0.0%), Norwegian (65.7%, a difference of 0.010%), Korean (65.7%, a difference of 0.010%), Immigrants from Ecuador (65.7%, a difference of 0.030%), and New Zealander (65.7%, a difference of 0.040%).
| Demographics | Rating | Rank | In Labor Force | Age > 16 |
| Argentineans | 96.7 /100 | #116 | Exceptional 65.7% |
| Immigrants | Iran | 96.6 /100 | #117 | Exceptional 65.7% |
| Immigrants | Thailand | 96.6 /100 | #118 | Exceptional 65.7% |
| Immigrants | France | 96.4 /100 | #119 | Exceptional 65.7% |
| Immigrants | Hong Kong | 96.2 /100 | #120 | Exceptional 65.7% |
| New Zealanders | 96.0 /100 | #121 | Exceptional 65.7% |
| Immigrants | Ecuador | 95.9 /100 | #122 | Exceptional 65.7% |
| Immigrants | Iraq | 95.5 /100 | #123 | Exceptional 65.7% |
| Iraqis | 95.4 /100 | #124 | Exceptional 65.7% |
| Norwegians | 95.3 /100 | #125 | Exceptional 65.7% |
| Koreans | 95.3 /100 | #126 | Exceptional 65.7% |
| Immigrants | Eastern Asia | 94.9 /100 | #127 | Exceptional 65.7% |
| Ecuadorians | 94.7 /100 | #128 | Exceptional 65.6% |
| Immigrants | Philippines | 94.5 /100 | #129 | Exceptional 65.6% |
| Immigrants | Guatemala | 94.4 /100 | #130 | Exceptional 65.6% |
Demographics Similar to Peruvians by In Labor Force | Age > 16
In terms of in labor force | age > 16, the demographic groups most similar to Peruvians are Venezuelan (66.3%, a difference of 0.0%), Sri Lankan (66.3%, a difference of 0.010%), Jordanian (66.3%, a difference of 0.030%), Immigrants from Peru (66.3%, a difference of 0.040%), and Immigrants from Burma/Myanmar (66.3%, a difference of 0.040%).
| Demographics | Rating | Rank | In Labor Force | Age > 16 |
| Bulgarians | 99.9 /100 | #57 | Exceptional 66.4% |
| Immigrants | Saudi Arabia | 99.9 /100 | #58 | Exceptional 66.3% |
| Immigrants | Turkey | 99.9 /100 | #59 | Exceptional 66.3% |
| Immigrants | Peru | 99.8 /100 | #60 | Exceptional 66.3% |
| Immigrants | Burma/Myanmar | 99.8 /100 | #61 | Exceptional 66.3% |
| Indonesians | 99.8 /100 | #62 | Exceptional 66.3% |
| Venezuelans | 99.8 /100 | #63 | Exceptional 66.3% |
| Peruvians | 99.8 /100 | #64 | Exceptional 66.3% |
| Sri Lankans | 99.8 /100 | #65 | Exceptional 66.3% |
| Jordanians | 99.8 /100 | #66 | Exceptional 66.3% |
| Egyptians | 99.8 /100 | #67 | Exceptional 66.2% |
| Immigrants | Egypt | 99.7 /100 | #68 | Exceptional 66.2% |
| Sub-Saharan Africans | 99.7 /100 | #69 | Exceptional 66.2% |
| Asians | 99.7 /100 | #70 | Exceptional 66.2% |
| Burmese | 99.7 /100 | #71 | Exceptional 66.2% |