Immigrants from Iraq vs Peruvian Median Earnings
COMPARE
Immigrants from Iraq
Peruvian
Median Earnings
Median Earnings Comparison
Immigrants from Iraq
Peruvians
$44,988
MEDIAN EARNINGS
11.6/ 100
METRIC RATING
228th/ 347
METRIC RANK
$47,628
MEDIAN EARNINGS
84.2/ 100
METRIC RATING
150th/ 347
METRIC RANK
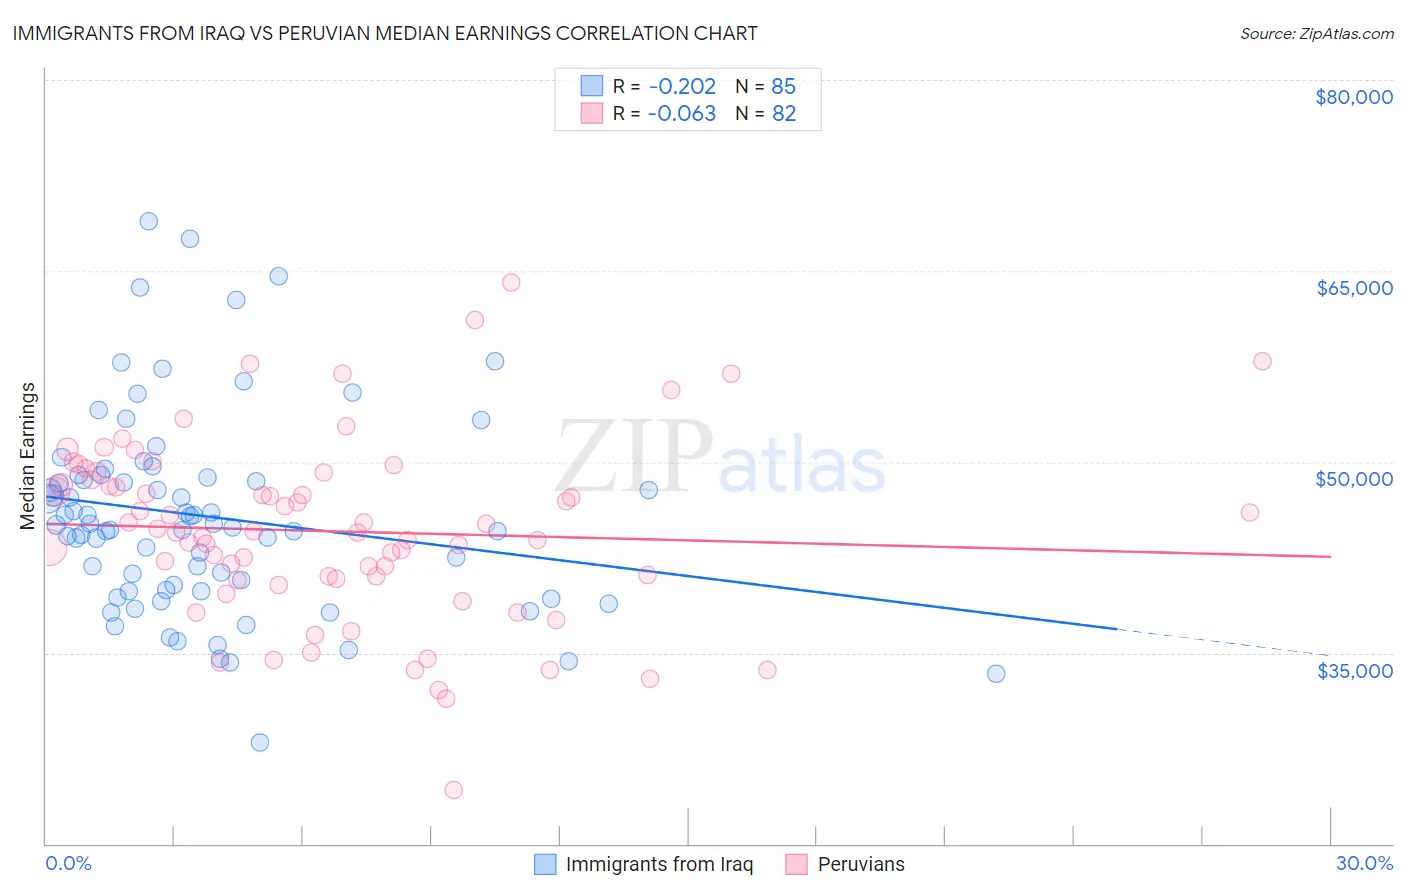
Immigrants from Iraq vs Peruvian Median Earnings Correlation Chart
The statistical analysis conducted on geographies consisting of 194,784,427 people shows a weak negative correlation between the proportion of Immigrants from Iraq and median earnings in the United States with a correlation coefficient (R) of -0.202 and weighted average of $44,988. Similarly, the statistical analysis conducted on geographies consisting of 363,247,580 people shows a slight negative correlation between the proportion of Peruvians and median earnings in the United States with a correlation coefficient (R) of -0.063 and weighted average of $47,628, a difference of 5.9%.
Median Earnings Correlation Summary
| Measurement | Immigrants from Iraq | Peruvian |
| Minimum | $27,932 | $24,212 |
| Maximum | $68,937 | $64,091 |
| Range | $41,005 | $39,879 |
| Mean | $45,692 | $44,547 |
| Median | $45,037 | $44,525 |
| Interquartile 25% (IQ1) | $39,916 | $40,828 |
| Interquartile 75% (IQ3) | $48,838 | $48,604 |
| Interquartile Range (IQR) | $8,923 | $7,775 |
| Standard Deviation (Sample) | $7,829 | $7,153 |
| Standard Deviation (Population) | $7,782 | $7,110 |
Similar Demographics by Median Earnings
Demographics Similar to Immigrants from Iraq by Median Earnings
In terms of median earnings, the demographic groups most similar to Immigrants from Iraq are Immigrants from Nigeria ($45,030, a difference of 0.090%), Native Hawaiian ($45,027, a difference of 0.090%), Scotch-Irish ($44,924, a difference of 0.14%), Immigrants from Western Africa ($44,893, a difference of 0.21%), and Immigrants from Cambodia ($45,090, a difference of 0.22%).
| Demographics | Rating | Rank | Median Earnings |
| Immigrants | Guyana | 15.1 /100 | #221 | Poor $45,204 |
| Immigrants | Panama | 15.0 /100 | #222 | Poor $45,198 |
| Whites/Caucasians | 15.0 /100 | #223 | Poor $45,197 |
| West Indians | 13.9 /100 | #224 | Poor $45,132 |
| Immigrants | Cambodia | 13.2 /100 | #225 | Poor $45,090 |
| Immigrants | Nigeria | 12.2 /100 | #226 | Poor $45,030 |
| Native Hawaiians | 12.2 /100 | #227 | Poor $45,027 |
| Immigrants | Iraq | 11.6 /100 | #228 | Poor $44,988 |
| Scotch-Irish | 10.7 /100 | #229 | Poor $44,924 |
| Immigrants | Western Africa | 10.3 /100 | #230 | Poor $44,893 |
| Japanese | 9.5 /100 | #231 | Tragic $44,825 |
| Delaware | 9.0 /100 | #232 | Tragic $44,783 |
| Immigrants | Sudan | 8.8 /100 | #233 | Tragic $44,767 |
| Cape Verdeans | 7.5 /100 | #234 | Tragic $44,640 |
| Venezuelans | 6.9 /100 | #235 | Tragic $44,580 |
Demographics Similar to Peruvians by Median Earnings
In terms of median earnings, the demographic groups most similar to Peruvians are Luxembourger ($47,640, a difference of 0.020%), Immigrants from Oceania ($47,617, a difference of 0.020%), Immigrants from Eritrea ($47,657, a difference of 0.060%), Immigrants from South Eastern Asia ($47,671, a difference of 0.090%), and Immigrants from Germany ($47,566, a difference of 0.13%).
| Demographics | Rating | Rank | Median Earnings |
| Swedes | 88.0 /100 | #143 | Excellent $47,851 |
| Hungarians | 87.1 /100 | #144 | Excellent $47,795 |
| Immigrants | Saudi Arabia | 85.6 /100 | #145 | Excellent $47,704 |
| Immigrants | Chile | 85.5 /100 | #146 | Excellent $47,697 |
| Immigrants | South Eastern Asia | 85.0 /100 | #147 | Excellent $47,671 |
| Immigrants | Eritrea | 84.8 /100 | #148 | Excellent $47,657 |
| Luxembourgers | 84.5 /100 | #149 | Excellent $47,640 |
| Peruvians | 84.2 /100 | #150 | Excellent $47,628 |
| Immigrants | Oceania | 84.1 /100 | #151 | Excellent $47,617 |
| Immigrants | Germany | 83.1 /100 | #152 | Excellent $47,566 |
| Slavs | 81.1 /100 | #153 | Excellent $47,470 |
| Immigrants | Portugal | 77.3 /100 | #154 | Good $47,304 |
| Immigrants | Vietnam | 76.7 /100 | #155 | Good $47,282 |
| Irish | 76.6 /100 | #156 | Good $47,276 |
| Czechs | 75.1 /100 | #157 | Good $47,221 |