Immigrants from Iraq vs Chinese In Labor Force | Age > 16
COMPARE
Immigrants from Iraq
Chinese
In Labor Force | Age > 16
In Labor Force | Age > 16 Comparison
Immigrants from Iraq
Chinese
65.7%
IN LABOR FORCE | AGE > 16
95.5/ 100
METRIC RATING
123rd/ 347
METRIC RANK
64.7%
IN LABOR FORCE | AGE > 16
7.3/ 100
METRIC RATING
230th/ 347
METRIC RANK
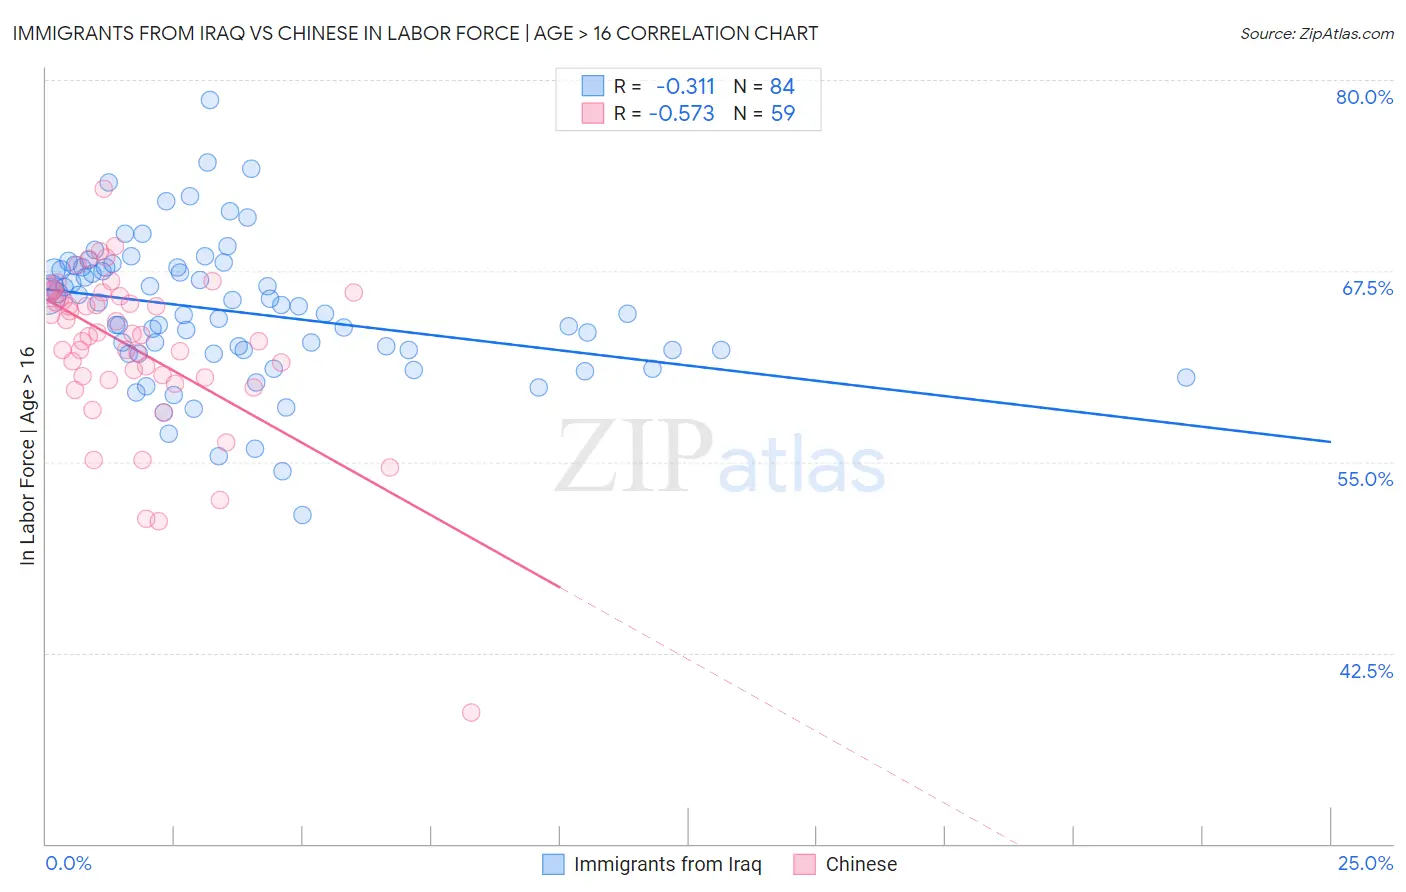
Immigrants from Iraq vs Chinese In Labor Force | Age > 16 Correlation Chart
The statistical analysis conducted on geographies consisting of 194,783,152 people shows a mild negative correlation between the proportion of Immigrants from Iraq and labor force participation rate among population ages 16 and over in the United States with a correlation coefficient (R) of -0.311 and weighted average of 65.7%. Similarly, the statistical analysis conducted on geographies consisting of 64,809,883 people shows a substantial negative correlation between the proportion of Chinese and labor force participation rate among population ages 16 and over in the United States with a correlation coefficient (R) of -0.573 and weighted average of 64.7%, a difference of 1.6%.
In Labor Force | Age > 16 Correlation Summary
| Measurement | Immigrants from Iraq | Chinese |
| Minimum | 51.5% | 38.6% |
| Maximum | 78.7% | 72.9% |
| Range | 27.2% | 34.3% |
| Mean | 64.8% | 62.4% |
| Median | 64.9% | 63.3% |
| Interquartile 25% (IQ1) | 62.2% | 60.5% |
| Interquartile 75% (IQ3) | 67.7% | 65.9% |
| Interquartile Range (IQR) | 5.5% | 5.4% |
| Standard Deviation (Sample) | 4.7% | 5.4% |
| Standard Deviation (Population) | 4.7% | 5.4% |
Similar Demographics by In Labor Force | Age > 16
Demographics Similar to Immigrants from Iraq by In Labor Force | Age > 16
In terms of in labor force | age > 16, the demographic groups most similar to Immigrants from Iraq are Iraqi (65.7%, a difference of 0.0%), Norwegian (65.7%, a difference of 0.010%), Korean (65.7%, a difference of 0.010%), Immigrants from Ecuador (65.7%, a difference of 0.030%), and New Zealander (65.7%, a difference of 0.040%).
| Demographics | Rating | Rank | In Labor Force | Age > 16 |
| Argentineans | 96.7 /100 | #116 | Exceptional 65.7% |
| Immigrants | Iran | 96.6 /100 | #117 | Exceptional 65.7% |
| Immigrants | Thailand | 96.6 /100 | #118 | Exceptional 65.7% |
| Immigrants | France | 96.4 /100 | #119 | Exceptional 65.7% |
| Immigrants | Hong Kong | 96.2 /100 | #120 | Exceptional 65.7% |
| New Zealanders | 96.0 /100 | #121 | Exceptional 65.7% |
| Immigrants | Ecuador | 95.9 /100 | #122 | Exceptional 65.7% |
| Immigrants | Iraq | 95.5 /100 | #123 | Exceptional 65.7% |
| Iraqis | 95.4 /100 | #124 | Exceptional 65.7% |
| Norwegians | 95.3 /100 | #125 | Exceptional 65.7% |
| Koreans | 95.3 /100 | #126 | Exceptional 65.7% |
| Immigrants | Eastern Asia | 94.9 /100 | #127 | Exceptional 65.7% |
| Ecuadorians | 94.7 /100 | #128 | Exceptional 65.6% |
| Immigrants | Philippines | 94.5 /100 | #129 | Exceptional 65.6% |
| Immigrants | Guatemala | 94.4 /100 | #130 | Exceptional 65.6% |
Demographics Similar to Chinese by In Labor Force | Age > 16
In terms of in labor force | age > 16, the demographic groups most similar to Chinese are British (64.7%, a difference of 0.0%), Immigrants from Northern Europe (64.7%, a difference of 0.0%), European (64.7%, a difference of 0.040%), Polish (64.7%, a difference of 0.040%), and Northern European (64.7%, a difference of 0.040%).
| Demographics | Rating | Rank | In Labor Force | Age > 16 |
| Immigrants | Belize | 9.2 /100 | #223 | Tragic 64.7% |
| Immigrants | Jamaica | 8.8 /100 | #224 | Tragic 64.7% |
| Croatians | 8.8 /100 | #225 | Tragic 64.7% |
| Europeans | 8.3 /100 | #226 | Tragic 64.7% |
| Poles | 8.3 /100 | #227 | Tragic 64.7% |
| Northern Europeans | 8.2 /100 | #228 | Tragic 64.7% |
| British | 7.3 /100 | #229 | Tragic 64.7% |
| Chinese | 7.3 /100 | #230 | Tragic 64.7% |
| Immigrants | Northern Europe | 7.2 /100 | #231 | Tragic 64.7% |
| Africans | 5.8 /100 | #232 | Tragic 64.6% |
| Slavs | 4.9 /100 | #233 | Tragic 64.6% |
| Vietnamese | 4.7 /100 | #234 | Tragic 64.6% |
| Austrians | 4.6 /100 | #235 | Tragic 64.6% |
| Immigrants | Norway | 4.6 /100 | #236 | Tragic 64.6% |
| Italians | 4.6 /100 | #237 | Tragic 64.6% |