Macedonian vs Paiute In Labor Force | Age 45-54
COMPARE
Macedonian
Paiute
In Labor Force | Age 45-54
In Labor Force | Age 45-54 Comparison
Macedonians
Paiute
83.5%
IN LABOR FORCE | AGE 45-54
98.7/ 100
METRIC RATING
55th/ 347
METRIC RANK
76.7%
IN LABOR FORCE | AGE 45-54
0.0/ 100
METRIC RATING
336th/ 347
METRIC RANK
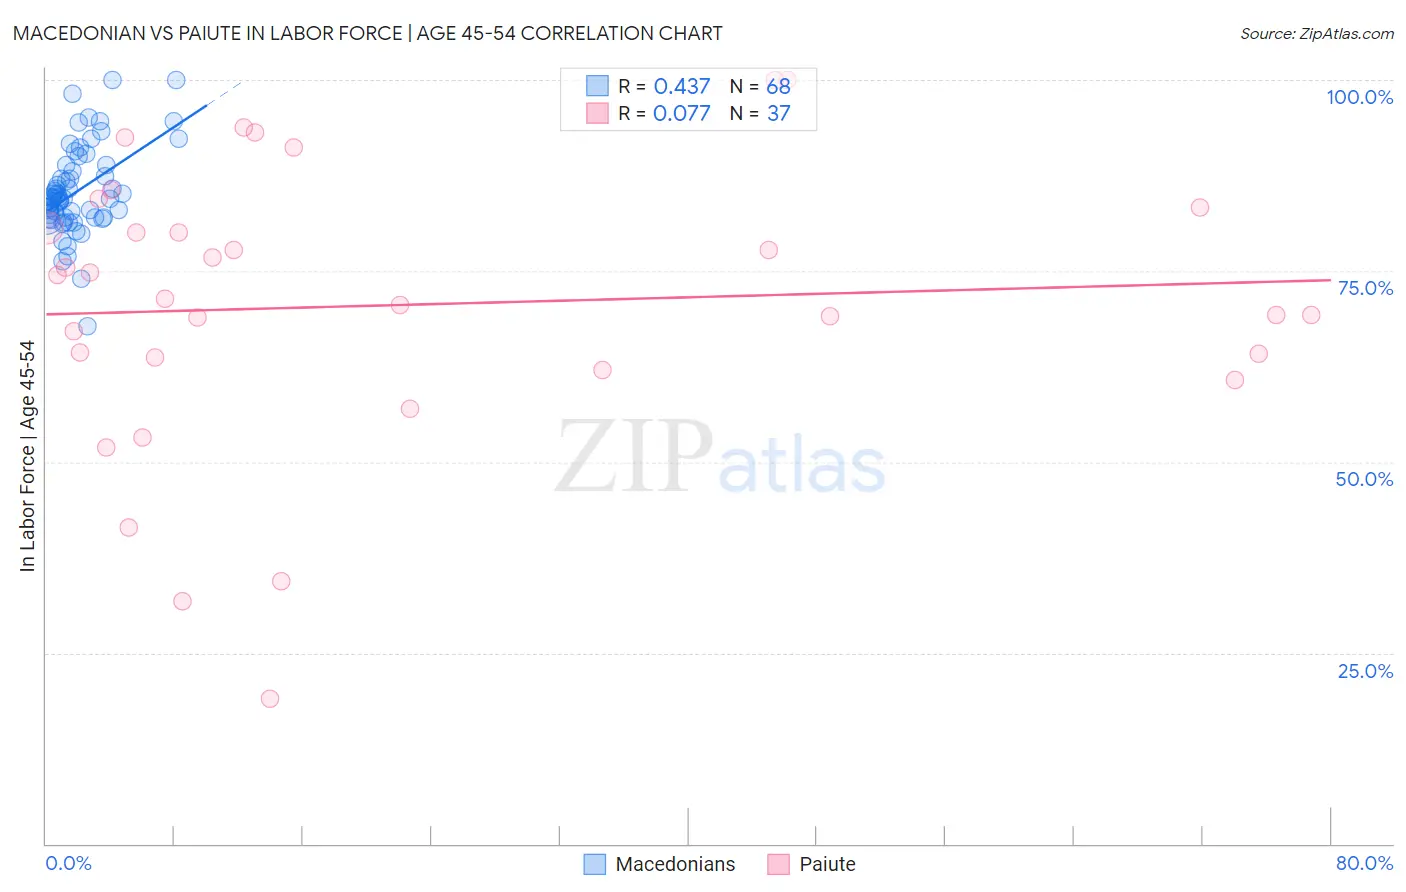
Macedonian vs Paiute In Labor Force | Age 45-54 Correlation Chart
The statistical analysis conducted on geographies consisting of 132,596,520 people shows a moderate positive correlation between the proportion of Macedonians and labor force participation rate among population between the ages 45 and 54 in the United States with a correlation coefficient (R) of 0.437 and weighted average of 83.5%. Similarly, the statistical analysis conducted on geographies consisting of 58,396,210 people shows a slight positive correlation between the proportion of Paiute and labor force participation rate among population between the ages 45 and 54 in the United States with a correlation coefficient (R) of 0.077 and weighted average of 76.7%, a difference of 9.0%.
In Labor Force | Age 45-54 Correlation Summary
| Measurement | Macedonian | Paiute |
| Minimum | 67.8% | 19.0% |
| Maximum | 100.0% | 100.0% |
| Range | 32.2% | 81.0% |
| Mean | 85.5% | 70.5% |
| Median | 84.5% | 71.4% |
| Interquartile 25% (IQ1) | 82.1% | 62.9% |
| Interquartile 75% (IQ3) | 88.5% | 82.0% |
| Interquartile Range (IQR) | 6.4% | 19.1% |
| Standard Deviation (Sample) | 5.8% | 18.4% |
| Standard Deviation (Population) | 5.7% | 18.2% |
Similar Demographics by In Labor Force | Age 45-54
Demographics Similar to Macedonians by In Labor Force | Age 45-54
In terms of in labor force | age 45-54, the demographic groups most similar to Macedonians are Somali (83.5%, a difference of 0.010%), Immigrants from Greece (83.6%, a difference of 0.020%), Immigrants from Turkey (83.6%, a difference of 0.020%), Polish (83.6%, a difference of 0.020%), and Peruvian (83.6%, a difference of 0.020%).
| Demographics | Rating | Rank | In Labor Force | Age 45-54 |
| Immigrants | Poland | 99.0 /100 | #48 | Exceptional 83.6% |
| Immigrants | Morocco | 99.0 /100 | #49 | Exceptional 83.6% |
| Immigrants | Greece | 98.8 /100 | #50 | Exceptional 83.6% |
| Immigrants | Turkey | 98.8 /100 | #51 | Exceptional 83.6% |
| Poles | 98.7 /100 | #52 | Exceptional 83.6% |
| Peruvians | 98.7 /100 | #53 | Exceptional 83.6% |
| Somalis | 98.7 /100 | #54 | Exceptional 83.5% |
| Macedonians | 98.7 /100 | #55 | Exceptional 83.5% |
| Immigrants | Peru | 98.6 /100 | #56 | Exceptional 83.5% |
| Paraguayans | 98.5 /100 | #57 | Exceptional 83.5% |
| Eastern Europeans | 98.5 /100 | #58 | Exceptional 83.5% |
| Bhutanese | 98.3 /100 | #59 | Exceptional 83.5% |
| Carpatho Rusyns | 98.3 /100 | #60 | Exceptional 83.5% |
| Filipinos | 98.3 /100 | #61 | Exceptional 83.5% |
| Immigrants | Taiwan | 98.0 /100 | #62 | Exceptional 83.5% |
Demographics Similar to Paiute by In Labor Force | Age 45-54
In terms of in labor force | age 45-54, the demographic groups most similar to Paiute are Ute (76.6%, a difference of 0.060%), Yuman (76.3%, a difference of 0.47%), Arapaho (77.1%, a difference of 0.54%), Native/Alaskan (77.1%, a difference of 0.61%), and Apache (77.1%, a difference of 0.61%).
| Demographics | Rating | Rank | In Labor Force | Age 45-54 |
| Creek | 0.0 /100 | #329 | Tragic 77.7% |
| Cheyenne | 0.0 /100 | #330 | Tragic 77.6% |
| Tsimshian | 0.0 /100 | #331 | Tragic 77.4% |
| Menominee | 0.0 /100 | #332 | Tragic 77.4% |
| Natives/Alaskans | 0.0 /100 | #333 | Tragic 77.1% |
| Apache | 0.0 /100 | #334 | Tragic 77.1% |
| Arapaho | 0.0 /100 | #335 | Tragic 77.1% |
| Paiute | 0.0 /100 | #336 | Tragic 76.7% |
| Ute | 0.0 /100 | #337 | Tragic 76.6% |
| Yuman | 0.0 /100 | #338 | Tragic 76.3% |
| Puerto Ricans | 0.0 /100 | #339 | Tragic 75.9% |
| Lumbee | 0.0 /100 | #340 | Tragic 75.6% |
| Pueblo | 0.0 /100 | #341 | Tragic 75.5% |
| Tohono O'odham | 0.0 /100 | #342 | Tragic 75.1% |
| Hopi | 0.0 /100 | #343 | Tragic 75.0% |