Immigrants from Trinidad and Tobago vs Paiute In Labor Force | Age 45-54
COMPARE
Immigrants from Trinidad and Tobago
Paiute
In Labor Force | Age 45-54
In Labor Force | Age 45-54 Comparison
Immigrants from Trinidad and Tobago
Paiute
82.0%
IN LABOR FORCE | AGE 45-54
1.2/ 100
METRIC RATING
237th/ 347
METRIC RANK
76.7%
IN LABOR FORCE | AGE 45-54
0.0/ 100
METRIC RATING
336th/ 347
METRIC RANK
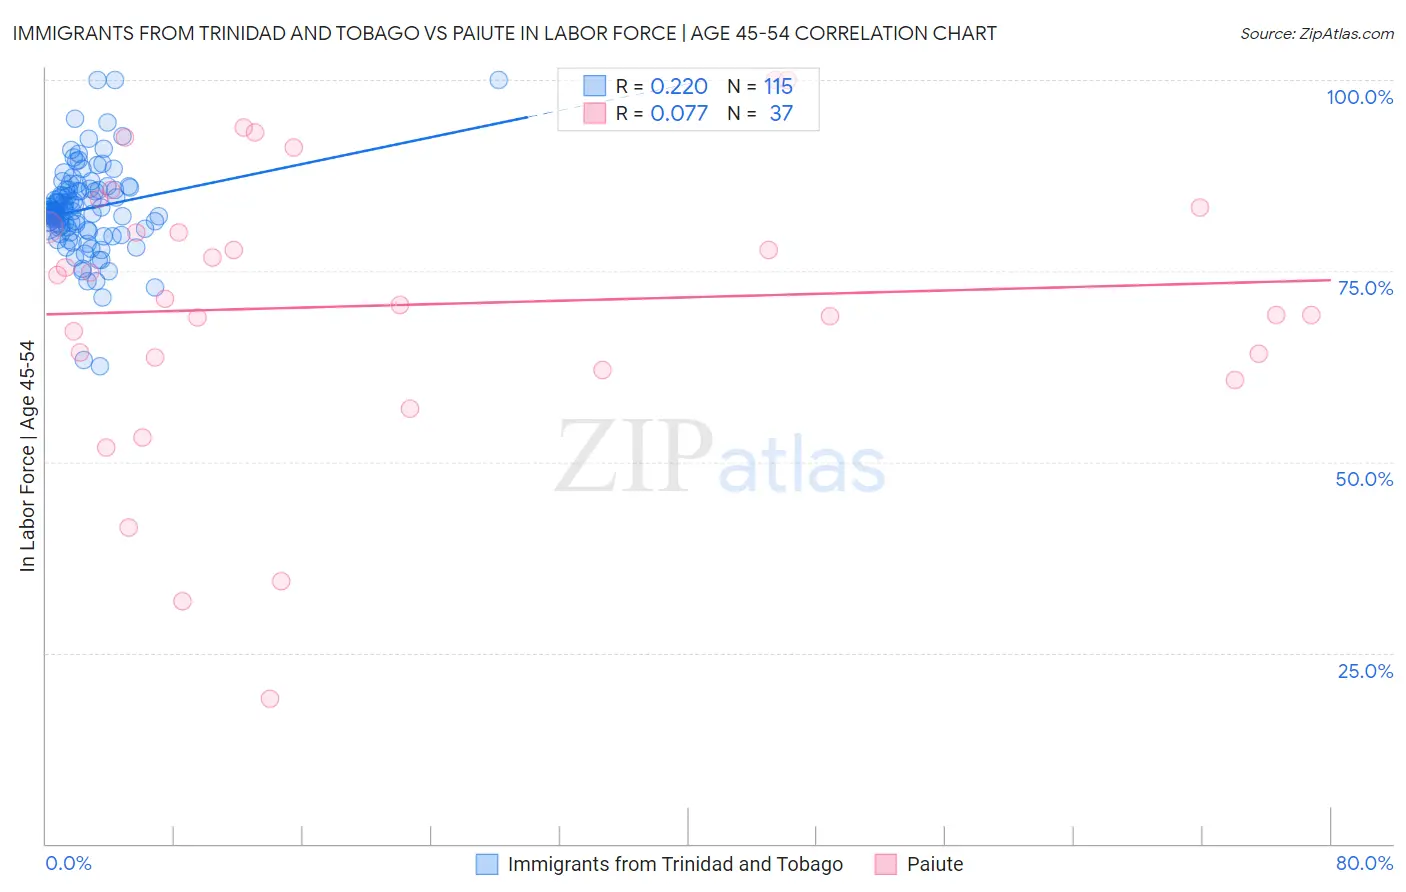
Immigrants from Trinidad and Tobago vs Paiute In Labor Force | Age 45-54 Correlation Chart
The statistical analysis conducted on geographies consisting of 223,484,344 people shows a weak positive correlation between the proportion of Immigrants from Trinidad and Tobago and labor force participation rate among population between the ages 45 and 54 in the United States with a correlation coefficient (R) of 0.220 and weighted average of 82.0%. Similarly, the statistical analysis conducted on geographies consisting of 58,396,210 people shows a slight positive correlation between the proportion of Paiute and labor force participation rate among population between the ages 45 and 54 in the United States with a correlation coefficient (R) of 0.077 and weighted average of 76.7%, a difference of 6.9%.
In Labor Force | Age 45-54 Correlation Summary
| Measurement | Immigrants from Trinidad and Tobago | Paiute |
| Minimum | 62.5% | 19.0% |
| Maximum | 100.0% | 100.0% |
| Range | 37.5% | 81.0% |
| Mean | 83.1% | 70.5% |
| Median | 82.8% | 71.4% |
| Interquartile 25% (IQ1) | 80.6% | 62.9% |
| Interquartile 75% (IQ3) | 85.6% | 82.0% |
| Interquartile Range (IQR) | 5.0% | 19.1% |
| Standard Deviation (Sample) | 5.8% | 18.4% |
| Standard Deviation (Population) | 5.8% | 18.2% |
Similar Demographics by In Labor Force | Age 45-54
Demographics Similar to Immigrants from Trinidad and Tobago by In Labor Force | Age 45-54
In terms of in labor force | age 45-54, the demographic groups most similar to Immigrants from Trinidad and Tobago are Subsaharan African (82.0%, a difference of 0.010%), Basque (82.0%, a difference of 0.010%), Trinidadian and Tobagonian (81.9%, a difference of 0.010%), Immigrants from Thailand (81.9%, a difference of 0.030%), and Immigrants from El Salvador (81.9%, a difference of 0.040%).
| Demographics | Rating | Rank | In Labor Force | Age 45-54 |
| Jamaicans | 1.8 /100 | #230 | Tragic 82.0% |
| Immigrants | Senegal | 1.7 /100 | #231 | Tragic 82.0% |
| Immigrants | Portugal | 1.7 /100 | #232 | Tragic 82.0% |
| Malaysians | 1.7 /100 | #233 | Tragic 82.0% |
| Salvadorans | 1.7 /100 | #234 | Tragic 82.0% |
| Sub-Saharan Africans | 1.2 /100 | #235 | Tragic 82.0% |
| Basques | 1.2 /100 | #236 | Tragic 82.0% |
| Immigrants | Trinidad and Tobago | 1.2 /100 | #237 | Tragic 82.0% |
| Trinidadians and Tobagonians | 1.1 /100 | #238 | Tragic 81.9% |
| Immigrants | Thailand | 1.0 /100 | #239 | Tragic 81.9% |
| Immigrants | El Salvador | 1.0 /100 | #240 | Tragic 81.9% |
| Immigrants | Cambodia | 0.8 /100 | #241 | Tragic 81.9% |
| Whites/Caucasians | 0.7 /100 | #242 | Tragic 81.9% |
| Samoans | 0.6 /100 | #243 | Tragic 81.8% |
| Celtics | 0.4 /100 | #244 | Tragic 81.8% |
Demographics Similar to Paiute by In Labor Force | Age 45-54
In terms of in labor force | age 45-54, the demographic groups most similar to Paiute are Ute (76.6%, a difference of 0.060%), Yuman (76.3%, a difference of 0.47%), Arapaho (77.1%, a difference of 0.54%), Native/Alaskan (77.1%, a difference of 0.61%), and Apache (77.1%, a difference of 0.61%).
| Demographics | Rating | Rank | In Labor Force | Age 45-54 |
| Creek | 0.0 /100 | #329 | Tragic 77.7% |
| Cheyenne | 0.0 /100 | #330 | Tragic 77.6% |
| Tsimshian | 0.0 /100 | #331 | Tragic 77.4% |
| Menominee | 0.0 /100 | #332 | Tragic 77.4% |
| Natives/Alaskans | 0.0 /100 | #333 | Tragic 77.1% |
| Apache | 0.0 /100 | #334 | Tragic 77.1% |
| Arapaho | 0.0 /100 | #335 | Tragic 77.1% |
| Paiute | 0.0 /100 | #336 | Tragic 76.7% |
| Ute | 0.0 /100 | #337 | Tragic 76.6% |
| Yuman | 0.0 /100 | #338 | Tragic 76.3% |
| Puerto Ricans | 0.0 /100 | #339 | Tragic 75.9% |
| Lumbee | 0.0 /100 | #340 | Tragic 75.6% |
| Pueblo | 0.0 /100 | #341 | Tragic 75.5% |
| Tohono O'odham | 0.0 /100 | #342 | Tragic 75.1% |
| Hopi | 0.0 /100 | #343 | Tragic 75.0% |