Immigrants from Iraq vs Immigrants from China In Labor Force | Age 16-19
COMPARE
Immigrants from Iraq
Immigrants from China
In Labor Force | Age 16-19
In Labor Force | Age 16-19 Comparison
Immigrants from Iraq
Immigrants from China
39.4%
IN LABOR FORCE | AGE 16-19
99.8/ 100
METRIC RATING
80th/ 347
METRIC RANK
31.1%
IN LABOR FORCE | AGE 16-19
0.0/ 100
METRIC RATING
325th/ 347
METRIC RANK
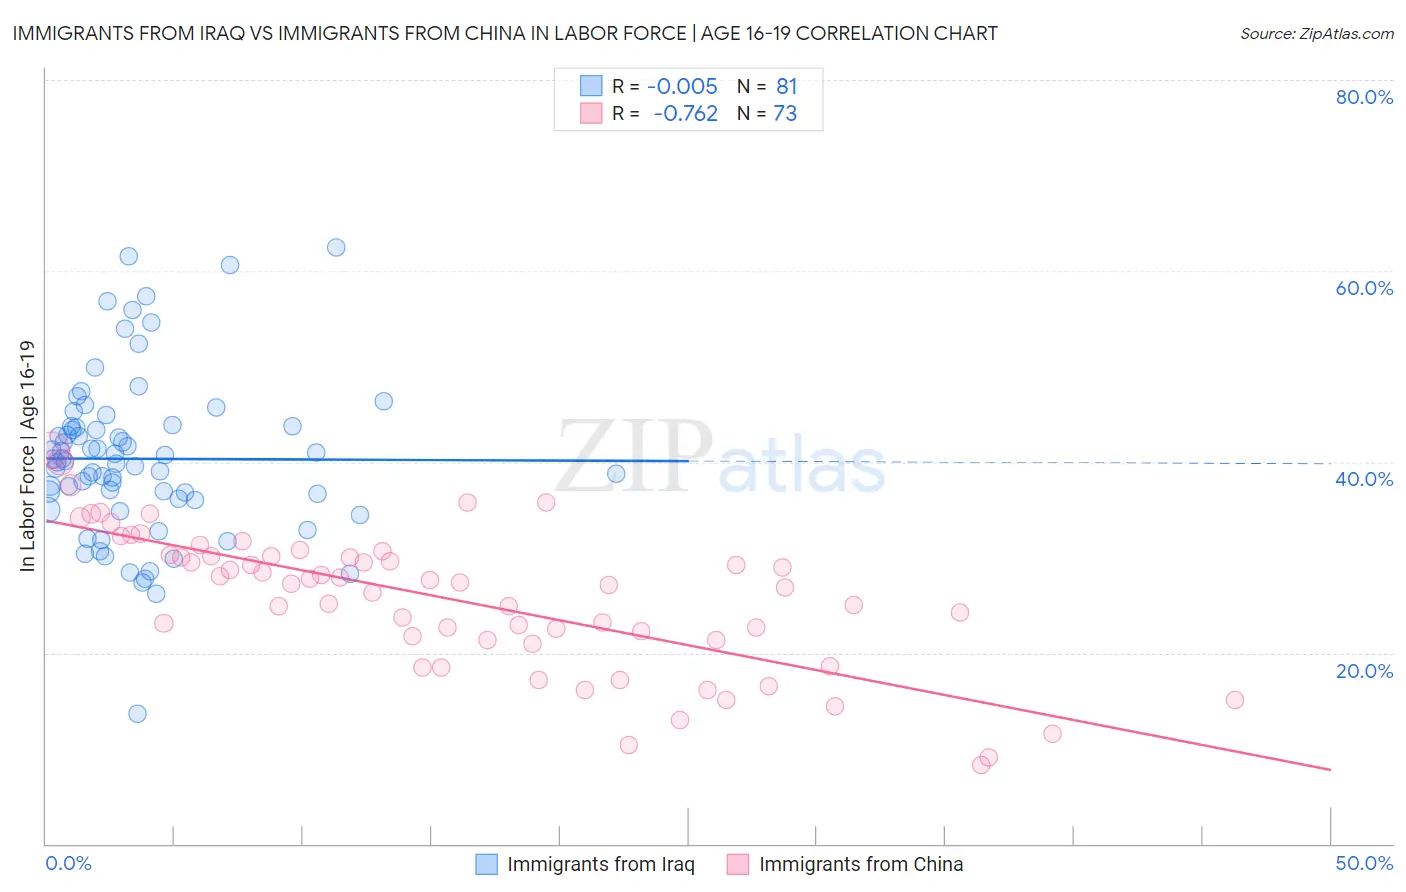
Immigrants from Iraq vs Immigrants from China In Labor Force | Age 16-19 Correlation Chart
The statistical analysis conducted on geographies consisting of 194,717,275 people shows no correlation between the proportion of Immigrants from Iraq and labor force participation rate among population between the ages 16 and 19 in the United States with a correlation coefficient (R) of -0.005 and weighted average of 39.4%. Similarly, the statistical analysis conducted on geographies consisting of 456,166,794 people shows a strong negative correlation between the proportion of Immigrants from China and labor force participation rate among population between the ages 16 and 19 in the United States with a correlation coefficient (R) of -0.762 and weighted average of 31.1%, a difference of 26.5%.
In Labor Force | Age 16-19 Correlation Summary
| Measurement | Immigrants from Iraq | Immigrants from China |
| Minimum | 13.6% | 8.3% |
| Maximum | 62.4% | 41.3% |
| Range | 48.8% | 33.0% |
| Mean | 40.3% | 25.6% |
| Median | 40.0% | 27.2% |
| Interquartile 25% (IQ1) | 36.1% | 21.3% |
| Interquartile 75% (IQ3) | 43.7% | 30.2% |
| Interquartile Range (IQR) | 7.6% | 8.8% |
| Standard Deviation (Sample) | 8.5% | 7.3% |
| Standard Deviation (Population) | 8.5% | 7.3% |
Similar Demographics by In Labor Force | Age 16-19
Demographics Similar to Immigrants from Iraq by In Labor Force | Age 16-19
In terms of in labor force | age 16-19, the demographic groups most similar to Immigrants from Iraq are Marshallese (39.5%, a difference of 0.18%), Shoshone (39.3%, a difference of 0.28%), Austrian (39.5%, a difference of 0.31%), Basque (39.3%, a difference of 0.34%), and Spanish (39.3%, a difference of 0.36%).
| Demographics | Rating | Rank | In Labor Force | Age 16-19 |
| Immigrants | Middle Africa | 99.9 /100 | #73 | Exceptional 39.9% |
| Hungarians | 99.9 /100 | #74 | Exceptional 39.8% |
| French American Indians | 99.9 /100 | #75 | Exceptional 39.8% |
| Malaysians | 99.9 /100 | #76 | Exceptional 39.7% |
| Immigrants | Portugal | 99.9 /100 | #77 | Exceptional 39.7% |
| Austrians | 99.8 /100 | #78 | Exceptional 39.5% |
| Marshallese | 99.8 /100 | #79 | Exceptional 39.5% |
| Immigrants | Iraq | 99.8 /100 | #80 | Exceptional 39.4% |
| Shoshone | 99.7 /100 | #81 | Exceptional 39.3% |
| Basques | 99.7 /100 | #82 | Exceptional 39.3% |
| Spanish | 99.7 /100 | #83 | Exceptional 39.3% |
| Immigrants | Uganda | 99.7 /100 | #84 | Exceptional 39.2% |
| Creek | 99.6 /100 | #85 | Exceptional 39.1% |
| Samoans | 99.6 /100 | #86 | Exceptional 39.1% |
| Immigrants | Germany | 99.6 /100 | #87 | Exceptional 39.1% |
Demographics Similar to Immigrants from China by In Labor Force | Age 16-19
In terms of in labor force | age 16-19, the demographic groups most similar to Immigrants from China are Dominican (31.2%, a difference of 0.15%), Immigrants from Dominican Republic (31.1%, a difference of 0.20%), Immigrants from Caribbean (31.2%, a difference of 0.33%), Immigrants from Taiwan (31.0%, a difference of 0.36%), and Immigrants from Ecuador (31.0%, a difference of 0.40%).
| Demographics | Rating | Rank | In Labor Force | Age 16-19 |
| Immigrants | Yemen | 0.0 /100 | #318 | Tragic 31.5% |
| Soviet Union | 0.0 /100 | #319 | Tragic 31.4% |
| Ecuadorians | 0.0 /100 | #320 | Tragic 31.4% |
| West Indians | 0.0 /100 | #321 | Tragic 31.3% |
| Tohono O'odham | 0.0 /100 | #322 | Tragic 31.3% |
| Immigrants | Caribbean | 0.0 /100 | #323 | Tragic 31.2% |
| Dominicans | 0.0 /100 | #324 | Tragic 31.2% |
| Immigrants | China | 0.0 /100 | #325 | Tragic 31.1% |
| Immigrants | Dominican Republic | 0.0 /100 | #326 | Tragic 31.1% |
| Immigrants | Taiwan | 0.0 /100 | #327 | Tragic 31.0% |
| Immigrants | Ecuador | 0.0 /100 | #328 | Tragic 31.0% |
| Barbadians | 0.0 /100 | #329 | Tragic 31.0% |
| Lumbee | 0.0 /100 | #330 | Tragic 31.0% |
| Trinidadians and Tobagonians | 0.0 /100 | #331 | Tragic 30.9% |
| Immigrants | Israel | 0.0 /100 | #332 | Tragic 30.5% |