Immigrants from Iraq vs Puerto Rican In Labor Force | Age 16-19
COMPARE
Immigrants from Iraq
Puerto Rican
In Labor Force | Age 16-19
In Labor Force | Age 16-19 Comparison
Immigrants from Iraq
Puerto Ricans
39.4%
IN LABOR FORCE | AGE 16-19
99.8/ 100
METRIC RATING
80th/ 347
METRIC RANK
30.3%
IN LABOR FORCE | AGE 16-19
0.0/ 100
METRIC RATING
334th/ 347
METRIC RANK
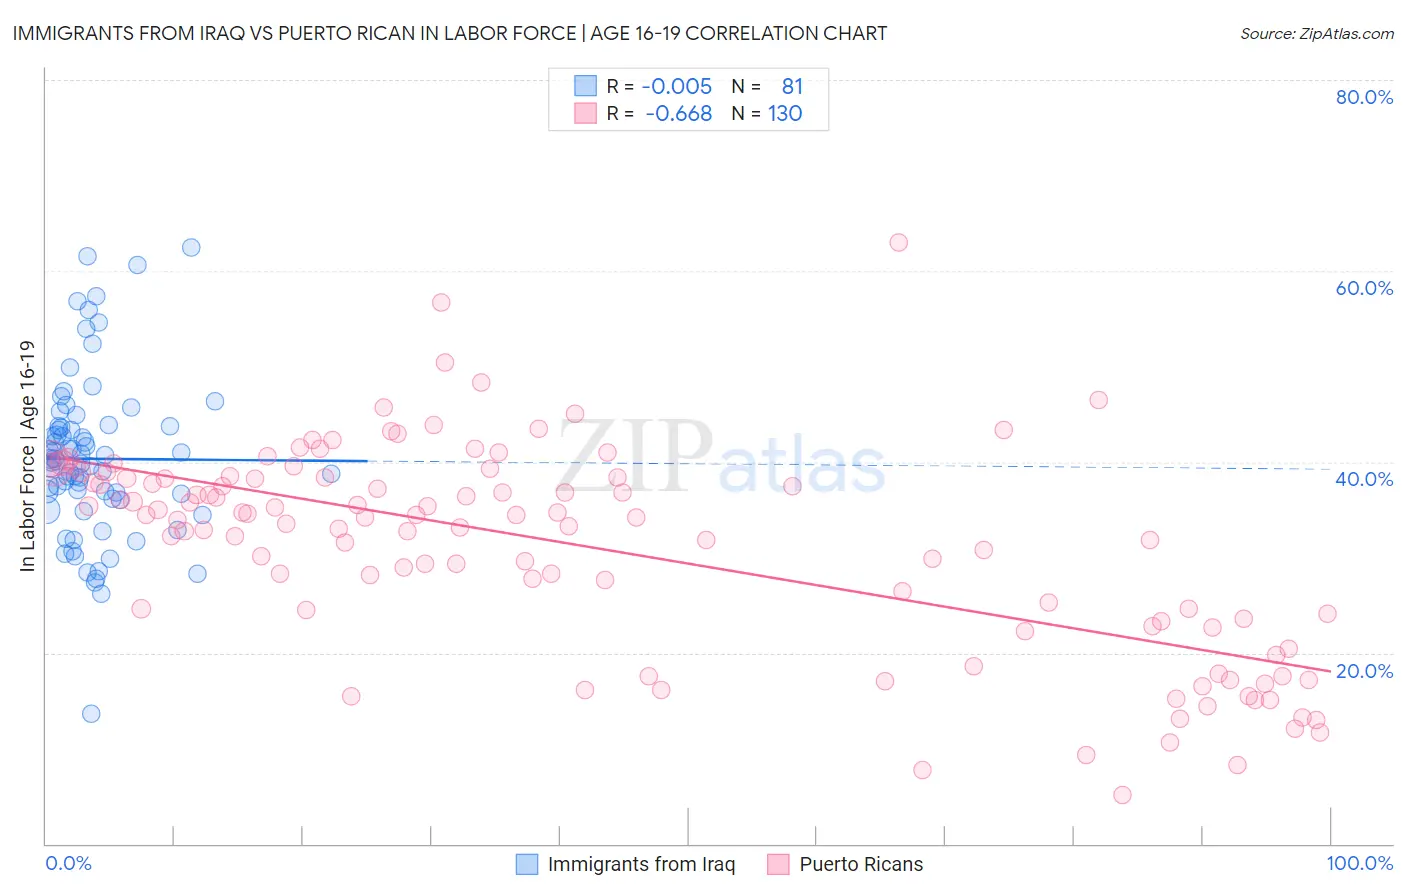
Immigrants from Iraq vs Puerto Rican In Labor Force | Age 16-19 Correlation Chart
The statistical analysis conducted on geographies consisting of 194,717,275 people shows no correlation between the proportion of Immigrants from Iraq and labor force participation rate among population between the ages 16 and 19 in the United States with a correlation coefficient (R) of -0.005 and weighted average of 39.4%. Similarly, the statistical analysis conducted on geographies consisting of 526,303,316 people shows a significant negative correlation between the proportion of Puerto Ricans and labor force participation rate among population between the ages 16 and 19 in the United States with a correlation coefficient (R) of -0.668 and weighted average of 30.3%, a difference of 29.8%.
In Labor Force | Age 16-19 Correlation Summary
| Measurement | Immigrants from Iraq | Puerto Rican |
| Minimum | 13.6% | 5.1% |
| Maximum | 62.4% | 63.0% |
| Range | 48.8% | 57.9% |
| Mean | 40.3% | 31.0% |
| Median | 40.0% | 34.0% |
| Interquartile 25% (IQ1) | 36.1% | 23.4% |
| Interquartile 75% (IQ3) | 43.7% | 38.3% |
| Interquartile Range (IQR) | 7.6% | 14.9% |
| Standard Deviation (Sample) | 8.5% | 10.9% |
| Standard Deviation (Population) | 8.5% | 10.8% |
Similar Demographics by In Labor Force | Age 16-19
Demographics Similar to Immigrants from Iraq by In Labor Force | Age 16-19
In terms of in labor force | age 16-19, the demographic groups most similar to Immigrants from Iraq are Marshallese (39.5%, a difference of 0.18%), Shoshone (39.3%, a difference of 0.28%), Austrian (39.5%, a difference of 0.31%), Basque (39.3%, a difference of 0.34%), and Spanish (39.3%, a difference of 0.36%).
| Demographics | Rating | Rank | In Labor Force | Age 16-19 |
| Immigrants | Middle Africa | 99.9 /100 | #73 | Exceptional 39.9% |
| Hungarians | 99.9 /100 | #74 | Exceptional 39.8% |
| French American Indians | 99.9 /100 | #75 | Exceptional 39.8% |
| Malaysians | 99.9 /100 | #76 | Exceptional 39.7% |
| Immigrants | Portugal | 99.9 /100 | #77 | Exceptional 39.7% |
| Austrians | 99.8 /100 | #78 | Exceptional 39.5% |
| Marshallese | 99.8 /100 | #79 | Exceptional 39.5% |
| Immigrants | Iraq | 99.8 /100 | #80 | Exceptional 39.4% |
| Shoshone | 99.7 /100 | #81 | Exceptional 39.3% |
| Basques | 99.7 /100 | #82 | Exceptional 39.3% |
| Spanish | 99.7 /100 | #83 | Exceptional 39.3% |
| Immigrants | Uganda | 99.7 /100 | #84 | Exceptional 39.2% |
| Creek | 99.6 /100 | #85 | Exceptional 39.1% |
| Samoans | 99.6 /100 | #86 | Exceptional 39.1% |
| Immigrants | Germany | 99.6 /100 | #87 | Exceptional 39.1% |
Demographics Similar to Puerto Ricans by In Labor Force | Age 16-19
In terms of in labor force | age 16-19, the demographic groups most similar to Puerto Ricans are Immigrants from Cuba (30.2%, a difference of 0.33%), Immigrants from Hong Kong (30.5%, a difference of 0.42%), Immigrants from Israel (30.5%, a difference of 0.44%), Immigrants from Trinidad and Tobago (30.2%, a difference of 0.62%), and Immigrants from Bangladesh (30.0%, a difference of 0.99%).
| Demographics | Rating | Rank | In Labor Force | Age 16-19 |
| Immigrants | Taiwan | 0.0 /100 | #327 | Tragic 31.0% |
| Immigrants | Ecuador | 0.0 /100 | #328 | Tragic 31.0% |
| Barbadians | 0.0 /100 | #329 | Tragic 31.0% |
| Lumbee | 0.0 /100 | #330 | Tragic 31.0% |
| Trinidadians and Tobagonians | 0.0 /100 | #331 | Tragic 30.9% |
| Immigrants | Israel | 0.0 /100 | #332 | Tragic 30.5% |
| Immigrants | Hong Kong | 0.0 /100 | #333 | Tragic 30.5% |
| Puerto Ricans | 0.0 /100 | #334 | Tragic 30.3% |
| Immigrants | Cuba | 0.0 /100 | #335 | Tragic 30.2% |
| Immigrants | Trinidad and Tobago | 0.0 /100 | #336 | Tragic 30.2% |
| Immigrants | Bangladesh | 0.0 /100 | #337 | Tragic 30.0% |
| Vietnamese | 0.0 /100 | #338 | Tragic 29.6% |
| Immigrants | Uzbekistan | 0.0 /100 | #339 | Tragic 29.2% |
| British West Indians | 0.0 /100 | #340 | Tragic 29.1% |
| Immigrants | Armenia | 0.0 /100 | #341 | Tragic 29.0% |