Immigrants from Iraq vs Immigrants from China Births to Unmarried Women
COMPARE
Immigrants from Iraq
Immigrants from China
Births to Unmarried Women
Births to Unmarried Women Comparison
Immigrants from Iraq
Immigrants from China
27.1%
BIRTHS TO UNMARRIED WOMEN
99.8/ 100
METRIC RATING
31st/ 347
METRIC RANK
24.7%
BIRTHS TO UNMARRIED WOMEN
100.0/ 100
METRIC RATING
8th/ 347
METRIC RANK
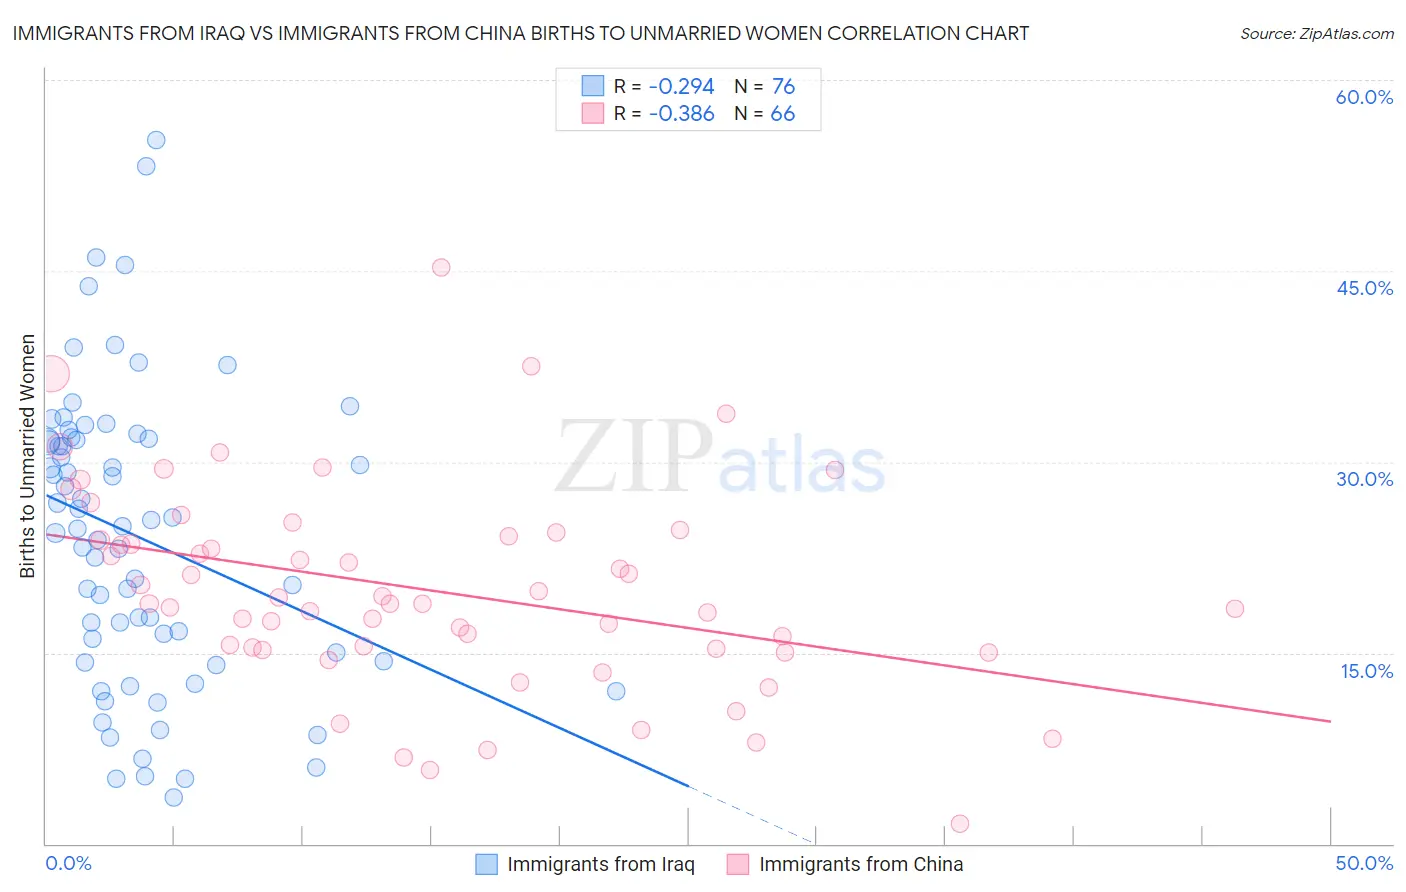
Immigrants from Iraq vs Immigrants from China Births to Unmarried Women Correlation Chart
The statistical analysis conducted on geographies consisting of 187,409,646 people shows a weak negative correlation between the proportion of Immigrants from Iraq and percentage of births to unmarried women in the United States with a correlation coefficient (R) of -0.294 and weighted average of 27.1%. Similarly, the statistical analysis conducted on geographies consisting of 420,563,672 people shows a mild negative correlation between the proportion of Immigrants from China and percentage of births to unmarried women in the United States with a correlation coefficient (R) of -0.386 and weighted average of 24.7%, a difference of 10.0%.
Births to Unmarried Women Correlation Summary
| Measurement | Immigrants from Iraq | Immigrants from China |
| Minimum | 3.6% | 1.6% |
| Maximum | 55.3% | 45.2% |
| Range | 51.7% | 43.6% |
| Mean | 24.1% | 19.9% |
| Median | 24.8% | 18.9% |
| Interquartile 25% (IQ1) | 14.6% | 15.3% |
| Interquartile 75% (IQ3) | 31.8% | 24.2% |
| Interquartile Range (IQR) | 17.1% | 8.9% |
| Standard Deviation (Sample) | 11.6% | 8.1% |
| Standard Deviation (Population) | 11.5% | 8.0% |
Similar Demographics by Births to Unmarried Women
Demographics Similar to Immigrants from Iraq by Births to Unmarried Women
In terms of births to unmarried women, the demographic groups most similar to Immigrants from Iraq are Immigrants from Russia (27.1%, a difference of 0.030%), Immigrants from Sri Lanka (27.2%, a difference of 0.10%), Immigrants from Pakistan (27.2%, a difference of 0.14%), Immigrants from Ireland (27.2%, a difference of 0.22%), and Bulgarian (27.1%, a difference of 0.29%).
| Demographics | Rating | Rank | Births to Unmarried Women |
| Immigrants | Australia | 99.9 /100 | #24 | Exceptional 26.6% |
| Cambodians | 99.9 /100 | #25 | Exceptional 26.7% |
| Asians | 99.9 /100 | #26 | Exceptional 26.8% |
| Immigrants | Asia | 99.9 /100 | #27 | Exceptional 26.8% |
| Okinawans | 99.8 /100 | #28 | Exceptional 26.9% |
| Cypriots | 99.8 /100 | #29 | Exceptional 27.0% |
| Bulgarians | 99.8 /100 | #30 | Exceptional 27.1% |
| Immigrants | Iraq | 99.8 /100 | #31 | Exceptional 27.1% |
| Immigrants | Russia | 99.8 /100 | #32 | Exceptional 27.1% |
| Immigrants | Sri Lanka | 99.8 /100 | #33 | Exceptional 27.2% |
| Immigrants | Pakistan | 99.8 /100 | #34 | Exceptional 27.2% |
| Immigrants | Ireland | 99.7 /100 | #35 | Exceptional 27.2% |
| Immigrants | Western Asia | 99.7 /100 | #36 | Exceptional 27.2% |
| Immigrants | Ukraine | 99.7 /100 | #37 | Exceptional 27.2% |
| Immigrants | Moldova | 99.7 /100 | #38 | Exceptional 27.3% |
Demographics Similar to Immigrants from China by Births to Unmarried Women
In terms of births to unmarried women, the demographic groups most similar to Immigrants from China are Immigrants from South Central Asia (24.7%, a difference of 0.010%), Immigrants from Eastern Asia (25.0%, a difference of 1.5%), Immigrants from Israel (25.1%, a difference of 1.9%), Indian (Asian) (25.3%, a difference of 2.4%), and Iranian (25.3%, a difference of 2.5%).
| Demographics | Rating | Rank | Births to Unmarried Women |
| Assyrians/Chaldeans/Syriacs | 100.0 /100 | #1 | Exceptional 22.0% |
| Immigrants | India | 100.0 /100 | #2 | Exceptional 22.9% |
| Filipinos | 100.0 /100 | #3 | Exceptional 23.0% |
| Immigrants | Taiwan | 100.0 /100 | #4 | Exceptional 23.0% |
| Immigrants | Hong Kong | 100.0 /100 | #5 | Exceptional 23.6% |
| Immigrants | Iran | 100.0 /100 | #6 | Exceptional 24.0% |
| Thais | 100.0 /100 | #7 | Exceptional 24.0% |
| Immigrants | China | 100.0 /100 | #8 | Exceptional 24.7% |
| Immigrants | South Central Asia | 100.0 /100 | #9 | Exceptional 24.7% |
| Immigrants | Eastern Asia | 100.0 /100 | #10 | Exceptional 25.0% |
| Immigrants | Israel | 100.0 /100 | #11 | Exceptional 25.1% |
| Indians (Asian) | 100.0 /100 | #12 | Exceptional 25.3% |
| Iranians | 100.0 /100 | #13 | Exceptional 25.3% |
| Immigrants | Lebanon | 100.0 /100 | #14 | Exceptional 25.3% |
| Immigrants | Singapore | 100.0 /100 | #15 | Exceptional 25.6% |