Sri Lankan vs Immigrants from China In Labor Force | Age 16-19
COMPARE
Sri Lankan
Immigrants from China
In Labor Force | Age 16-19
In Labor Force | Age 16-19 Comparison
Sri Lankans
Immigrants from China
35.5%
IN LABOR FORCE | AGE 16-19
9.8/ 100
METRIC RATING
218th/ 347
METRIC RANK
31.1%
IN LABOR FORCE | AGE 16-19
0.0/ 100
METRIC RATING
325th/ 347
METRIC RANK
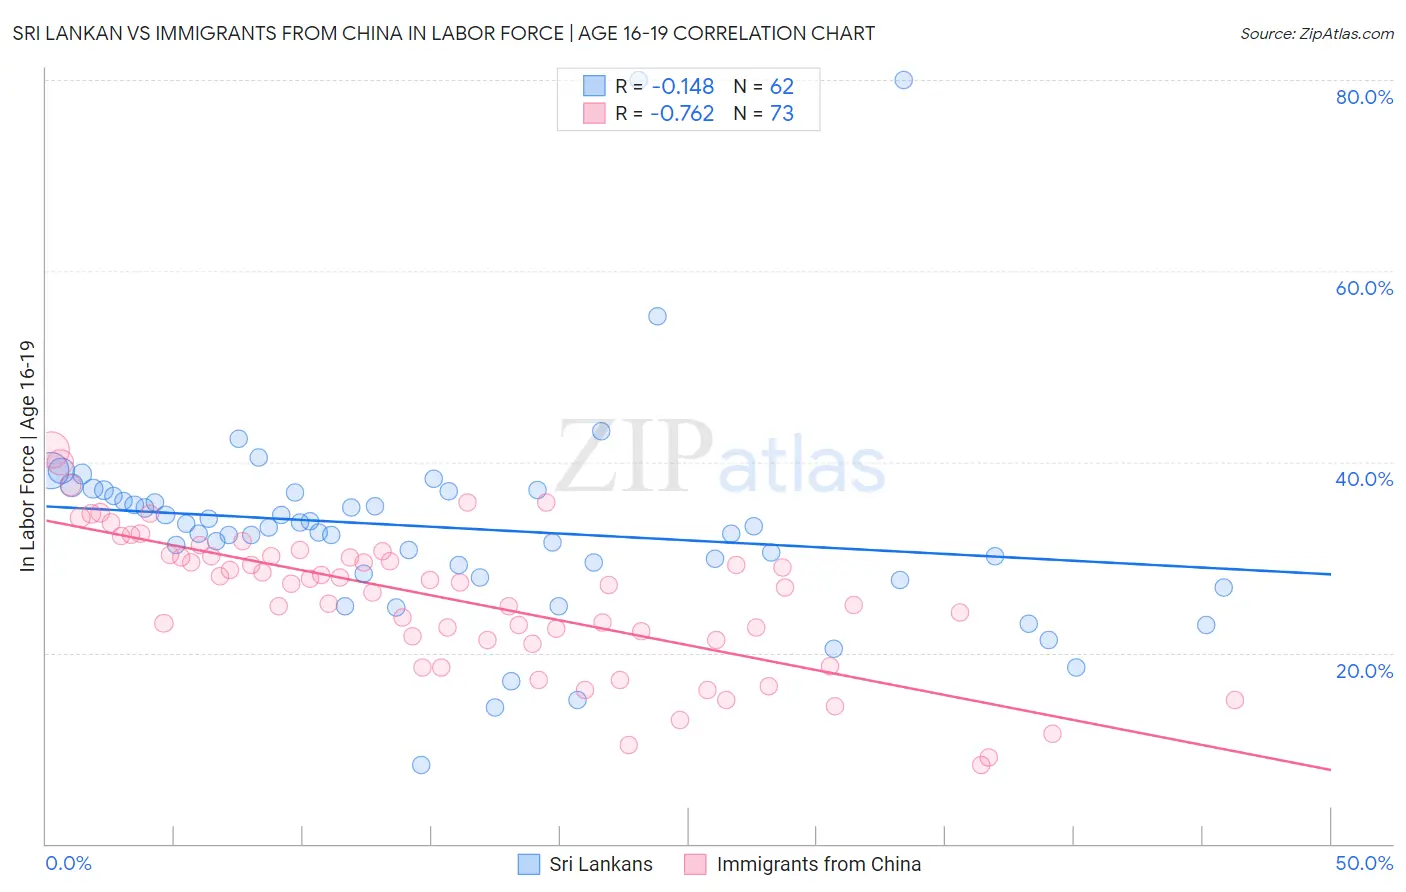
Sri Lankan vs Immigrants from China In Labor Force | Age 16-19 Correlation Chart
The statistical analysis conducted on geographies consisting of 440,040,037 people shows a poor negative correlation between the proportion of Sri Lankans and labor force participation rate among population between the ages 16 and 19 in the United States with a correlation coefficient (R) of -0.148 and weighted average of 35.5%. Similarly, the statistical analysis conducted on geographies consisting of 456,166,794 people shows a strong negative correlation between the proportion of Immigrants from China and labor force participation rate among population between the ages 16 and 19 in the United States with a correlation coefficient (R) of -0.762 and weighted average of 31.1%, a difference of 14.1%.
In Labor Force | Age 16-19 Correlation Summary
| Measurement | Sri Lankan | Immigrants from China |
| Minimum | 8.2% | 8.3% |
| Maximum | 80.0% | 41.3% |
| Range | 71.8% | 33.0% |
| Mean | 33.1% | 25.6% |
| Median | 32.9% | 27.2% |
| Interquartile 25% (IQ1) | 28.3% | 21.3% |
| Interquartile 75% (IQ3) | 36.8% | 30.2% |
| Interquartile Range (IQR) | 8.5% | 8.8% |
| Standard Deviation (Sample) | 11.5% | 7.3% |
| Standard Deviation (Population) | 11.4% | 7.3% |
Similar Demographics by In Labor Force | Age 16-19
Demographics Similar to Sri Lankans by In Labor Force | Age 16-19
In terms of in labor force | age 16-19, the demographic groups most similar to Sri Lankans are Dutch West Indian (35.6%, a difference of 0.12%), Immigrants from Costa Rica (35.6%, a difference of 0.12%), Immigrants from South Eastern Asia (35.6%, a difference of 0.14%), Apache (35.6%, a difference of 0.16%), and Houma (35.6%, a difference of 0.17%).
| Demographics | Rating | Rank | In Labor Force | Age 16-19 |
| Mexicans | 11.9 /100 | #211 | Poor 35.6% |
| Houma | 11.0 /100 | #212 | Poor 35.6% |
| Immigrants | Bolivia | 11.0 /100 | #213 | Poor 35.6% |
| Apache | 11.0 /100 | #214 | Poor 35.6% |
| Immigrants | South Eastern Asia | 10.8 /100 | #215 | Poor 35.6% |
| Dutch West Indians | 10.7 /100 | #216 | Poor 35.6% |
| Immigrants | Costa Rica | 10.7 /100 | #217 | Poor 35.6% |
| Sri Lankans | 9.8 /100 | #218 | Tragic 35.5% |
| Guatemalans | 8.6 /100 | #219 | Tragic 35.5% |
| Immigrants | Bahamas | 8.3 /100 | #220 | Tragic 35.5% |
| Turks | 7.3 /100 | #221 | Tragic 35.4% |
| Immigrants | Ghana | 7.3 /100 | #222 | Tragic 35.4% |
| Ghanaians | 6.5 /100 | #223 | Tragic 35.3% |
| Hondurans | 6.5 /100 | #224 | Tragic 35.3% |
| Immigrants | Belgium | 6.1 /100 | #225 | Tragic 35.3% |
Demographics Similar to Immigrants from China by In Labor Force | Age 16-19
In terms of in labor force | age 16-19, the demographic groups most similar to Immigrants from China are Dominican (31.2%, a difference of 0.15%), Immigrants from Dominican Republic (31.1%, a difference of 0.20%), Immigrants from Caribbean (31.2%, a difference of 0.33%), Immigrants from Taiwan (31.0%, a difference of 0.36%), and Immigrants from Ecuador (31.0%, a difference of 0.40%).
| Demographics | Rating | Rank | In Labor Force | Age 16-19 |
| Immigrants | Yemen | 0.0 /100 | #318 | Tragic 31.5% |
| Soviet Union | 0.0 /100 | #319 | Tragic 31.4% |
| Ecuadorians | 0.0 /100 | #320 | Tragic 31.4% |
| West Indians | 0.0 /100 | #321 | Tragic 31.3% |
| Tohono O'odham | 0.0 /100 | #322 | Tragic 31.3% |
| Immigrants | Caribbean | 0.0 /100 | #323 | Tragic 31.2% |
| Dominicans | 0.0 /100 | #324 | Tragic 31.2% |
| Immigrants | China | 0.0 /100 | #325 | Tragic 31.1% |
| Immigrants | Dominican Republic | 0.0 /100 | #326 | Tragic 31.1% |
| Immigrants | Taiwan | 0.0 /100 | #327 | Tragic 31.0% |
| Immigrants | Ecuador | 0.0 /100 | #328 | Tragic 31.0% |
| Barbadians | 0.0 /100 | #329 | Tragic 31.0% |
| Lumbee | 0.0 /100 | #330 | Tragic 31.0% |
| Trinidadians and Tobagonians | 0.0 /100 | #331 | Tragic 30.9% |
| Immigrants | Israel | 0.0 /100 | #332 | Tragic 30.5% |