Immigrants from Iraq vs Osage In Labor Force | Age 16-19
COMPARE
Immigrants from Iraq
Osage
In Labor Force | Age 16-19
In Labor Force | Age 16-19 Comparison
Immigrants from Iraq
Osage
39.4%
IN LABOR FORCE | AGE 16-19
99.8/ 100
METRIC RATING
80th/ 347
METRIC RANK
39.0%
IN LABOR FORCE | AGE 16-19
99.4/ 100
METRIC RATING
92nd/ 347
METRIC RANK
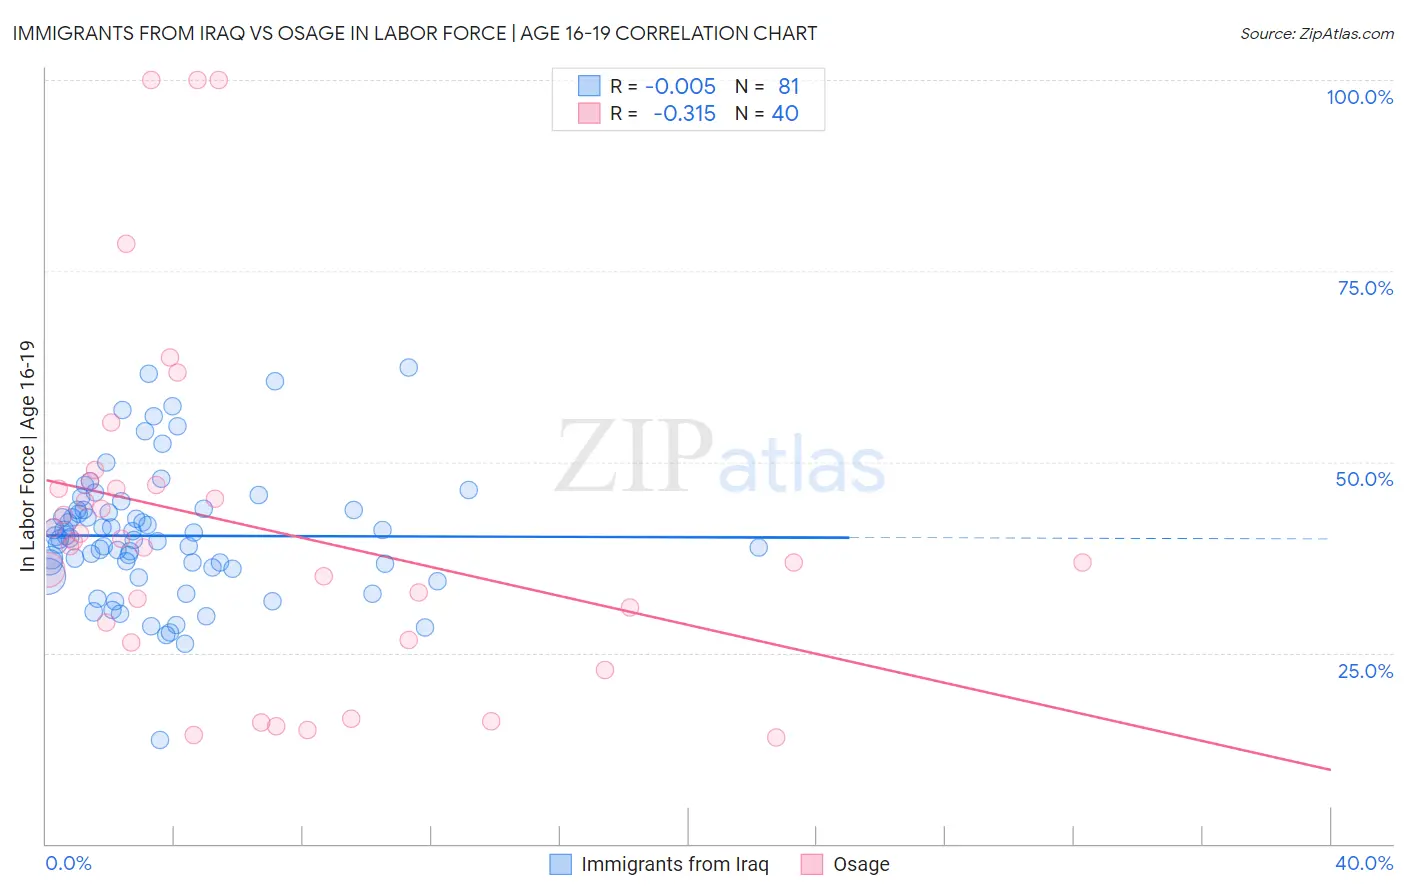
Immigrants from Iraq vs Osage In Labor Force | Age 16-19 Correlation Chart
The statistical analysis conducted on geographies consisting of 194,717,275 people shows no correlation between the proportion of Immigrants from Iraq and labor force participation rate among population between the ages 16 and 19 in the United States with a correlation coefficient (R) of -0.005 and weighted average of 39.4%. Similarly, the statistical analysis conducted on geographies consisting of 91,776,050 people shows a mild negative correlation between the proportion of Osage and labor force participation rate among population between the ages 16 and 19 in the United States with a correlation coefficient (R) of -0.315 and weighted average of 39.0%, a difference of 1.1%.
In Labor Force | Age 16-19 Correlation Summary
| Measurement | Immigrants from Iraq | Osage |
| Minimum | 13.6% | 13.9% |
| Maximum | 62.4% | 100.0% |
| Range | 48.8% | 86.1% |
| Mean | 40.3% | 41.6% |
| Median | 40.0% | 39.3% |
| Interquartile 25% (IQ1) | 36.1% | 27.8% |
| Interquartile 75% (IQ3) | 43.7% | 46.7% |
| Interquartile Range (IQR) | 7.6% | 19.0% |
| Standard Deviation (Sample) | 8.5% | 22.1% |
| Standard Deviation (Population) | 8.5% | 21.9% |
Demographics Similar to Immigrants from Iraq and Osage by In Labor Force | Age 16-19
In terms of in labor force | age 16-19, the demographic groups most similar to Immigrants from Iraq are Marshallese (39.5%, a difference of 0.18%), Shoshone (39.3%, a difference of 0.28%), Austrian (39.5%, a difference of 0.31%), Basque (39.3%, a difference of 0.34%), and Spanish (39.3%, a difference of 0.36%). Similarly, the demographic groups most similar to Osage are Blackfeet (38.9%, a difference of 0.060%), Immigrants from Canada (38.9%, a difference of 0.060%), Spanish American (39.0%, a difference of 0.090%), Immigrants from North America (38.9%, a difference of 0.15%), and Latvian (38.9%, a difference of 0.18%).
| Demographics | Rating | Rank | In Labor Force | Age 16-19 |
| Malaysians | 99.9 /100 | #76 | Exceptional 39.7% |
| Immigrants | Portugal | 99.9 /100 | #77 | Exceptional 39.7% |
| Austrians | 99.8 /100 | #78 | Exceptional 39.5% |
| Marshallese | 99.8 /100 | #79 | Exceptional 39.5% |
| Immigrants | Iraq | 99.8 /100 | #80 | Exceptional 39.4% |
| Shoshone | 99.7 /100 | #81 | Exceptional 39.3% |
| Basques | 99.7 /100 | #82 | Exceptional 39.3% |
| Spanish | 99.7 /100 | #83 | Exceptional 39.3% |
| Immigrants | Uganda | 99.7 /100 | #84 | Exceptional 39.2% |
| Creek | 99.6 /100 | #85 | Exceptional 39.1% |
| Samoans | 99.6 /100 | #86 | Exceptional 39.1% |
| Immigrants | Germany | 99.6 /100 | #87 | Exceptional 39.1% |
| Puget Sound Salish | 99.6 /100 | #88 | Exceptional 39.1% |
| Alaska Natives | 99.6 /100 | #89 | Exceptional 39.1% |
| Immigrants | Burma/Myanmar | 99.5 /100 | #90 | Exceptional 39.0% |
| Spanish Americans | 99.5 /100 | #91 | Exceptional 39.0% |
| Osage | 99.4 /100 | #92 | Exceptional 39.0% |
| Blackfeet | 99.4 /100 | #93 | Exceptional 38.9% |
| Immigrants | Canada | 99.4 /100 | #94 | Exceptional 38.9% |
| Immigrants | North America | 99.4 /100 | #95 | Exceptional 38.9% |
| Latvians | 99.4 /100 | #96 | Exceptional 38.9% |