Immigrants from Iraq vs Serbian In Labor Force | Age 16-19
COMPARE
Immigrants from Iraq
Serbian
In Labor Force | Age 16-19
In Labor Force | Age 16-19 Comparison
Immigrants from Iraq
Serbians
39.4%
IN LABOR FORCE | AGE 16-19
99.8/ 100
METRIC RATING
80th/ 347
METRIC RANK
39.9%
IN LABOR FORCE | AGE 16-19
99.9/ 100
METRIC RATING
71st/ 347
METRIC RANK
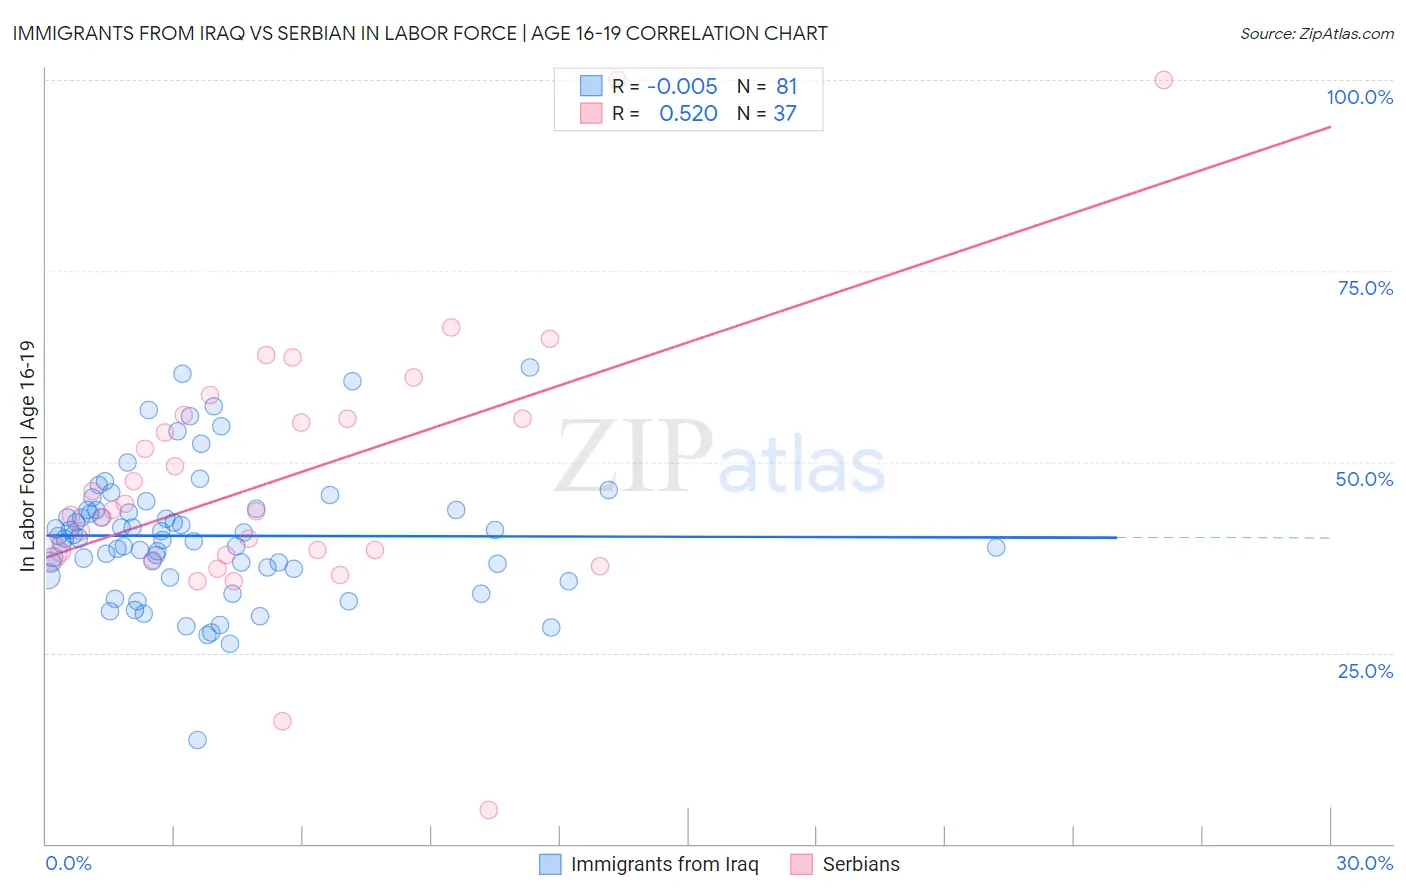
Immigrants from Iraq vs Serbian In Labor Force | Age 16-19 Correlation Chart
The statistical analysis conducted on geographies consisting of 194,717,275 people shows no correlation between the proportion of Immigrants from Iraq and labor force participation rate among population between the ages 16 and 19 in the United States with a correlation coefficient (R) of -0.005 and weighted average of 39.4%. Similarly, the statistical analysis conducted on geographies consisting of 267,337,384 people shows a substantial positive correlation between the proportion of Serbians and labor force participation rate among population between the ages 16 and 19 in the United States with a correlation coefficient (R) of 0.520 and weighted average of 39.9%, a difference of 1.4%.
In Labor Force | Age 16-19 Correlation Summary
| Measurement | Immigrants from Iraq | Serbian |
| Minimum | 13.6% | 4.4% |
| Maximum | 62.4% | 100.0% |
| Range | 48.8% | 95.6% |
| Mean | 40.3% | 48.0% |
| Median | 40.0% | 43.6% |
| Interquartile 25% (IQ1) | 36.1% | 37.9% |
| Interquartile 75% (IQ3) | 43.7% | 55.9% |
| Interquartile Range (IQR) | 7.6% | 18.0% |
| Standard Deviation (Sample) | 8.5% | 18.1% |
| Standard Deviation (Population) | 8.5% | 17.8% |
Demographics Similar to Immigrants from Iraq and Serbians by In Labor Force | Age 16-19
In terms of in labor force | age 16-19, the demographic groups most similar to Immigrants from Iraq are Marshallese (39.5%, a difference of 0.18%), Shoshone (39.3%, a difference of 0.28%), Austrian (39.5%, a difference of 0.31%), Basque (39.3%, a difference of 0.34%), and Spanish (39.3%, a difference of 0.36%). Similarly, the demographic groups most similar to Serbians are Iroquois (39.9%, a difference of 0.010%), Immigrants from Middle Africa (39.9%, a difference of 0.040%), Portuguese (40.0%, a difference of 0.17%), Potawatomi (40.0%, a difference of 0.22%), and Hungarian (39.8%, a difference of 0.27%).
| Demographics | Rating | Rank | In Labor Force | Age 16-19 |
| Kenyans | 100.0 /100 | #65 | Exceptional 40.1% |
| Immigrants | Nonimmigrants | 100.0 /100 | #66 | Exceptional 40.1% |
| Canadians | 100.0 /100 | #67 | Exceptional 40.1% |
| Italians | 99.9 /100 | #68 | Exceptional 40.1% |
| Potawatomi | 99.9 /100 | #69 | Exceptional 40.0% |
| Portuguese | 99.9 /100 | #70 | Exceptional 40.0% |
| Serbians | 99.9 /100 | #71 | Exceptional 39.9% |
| Iroquois | 99.9 /100 | #72 | Exceptional 39.9% |
| Immigrants | Middle Africa | 99.9 /100 | #73 | Exceptional 39.9% |
| Hungarians | 99.9 /100 | #74 | Exceptional 39.8% |
| French American Indians | 99.9 /100 | #75 | Exceptional 39.8% |
| Malaysians | 99.9 /100 | #76 | Exceptional 39.7% |
| Immigrants | Portugal | 99.9 /100 | #77 | Exceptional 39.7% |
| Austrians | 99.8 /100 | #78 | Exceptional 39.5% |
| Marshallese | 99.8 /100 | #79 | Exceptional 39.5% |
| Immigrants | Iraq | 99.8 /100 | #80 | Exceptional 39.4% |
| Shoshone | 99.7 /100 | #81 | Exceptional 39.3% |
| Basques | 99.7 /100 | #82 | Exceptional 39.3% |
| Spanish | 99.7 /100 | #83 | Exceptional 39.3% |
| Immigrants | Uganda | 99.7 /100 | #84 | Exceptional 39.2% |
| Creek | 99.6 /100 | #85 | Exceptional 39.1% |