German vs Immigrants from China In Labor Force | Age 16-19
COMPARE
German
Immigrants from China
In Labor Force | Age 16-19
In Labor Force | Age 16-19 Comparison
Germans
Immigrants from China
44.2%
IN LABOR FORCE | AGE 16-19
100.0/ 100
METRIC RATING
10th/ 347
METRIC RANK
31.1%
IN LABOR FORCE | AGE 16-19
0.0/ 100
METRIC RATING
325th/ 347
METRIC RANK
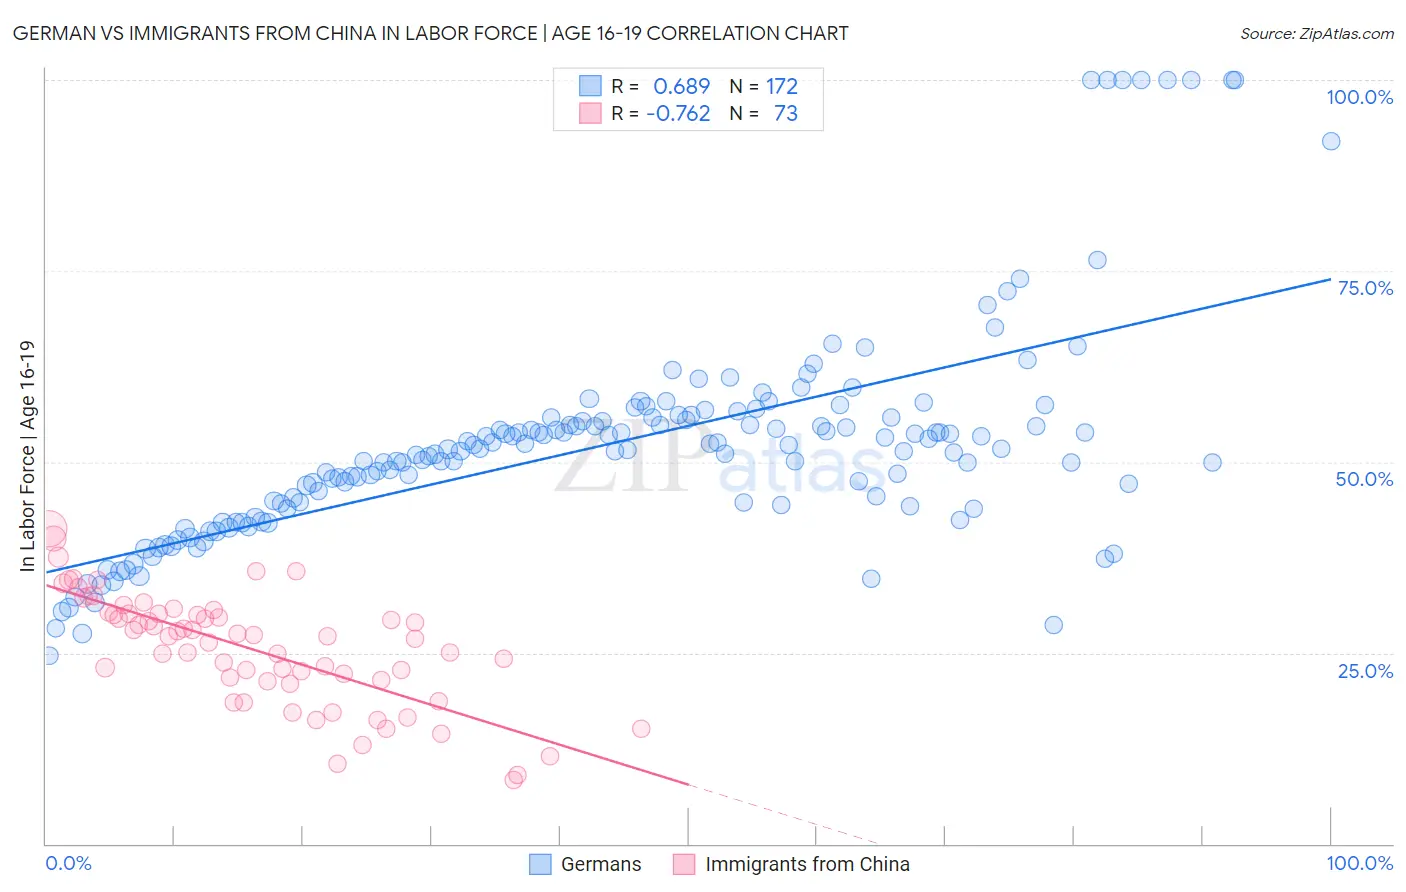
German vs Immigrants from China In Labor Force | Age 16-19 Correlation Chart
The statistical analysis conducted on geographies consisting of 575,301,683 people shows a significant positive correlation between the proportion of Germans and labor force participation rate among population between the ages 16 and 19 in the United States with a correlation coefficient (R) of 0.689 and weighted average of 44.2%. Similarly, the statistical analysis conducted on geographies consisting of 456,166,794 people shows a strong negative correlation between the proportion of Immigrants from China and labor force participation rate among population between the ages 16 and 19 in the United States with a correlation coefficient (R) of -0.762 and weighted average of 31.1%, a difference of 41.8%.
In Labor Force | Age 16-19 Correlation Summary
| Measurement | German | Immigrants from China |
| Minimum | 24.6% | 8.3% |
| Maximum | 100.0% | 41.3% |
| Range | 75.4% | 33.0% |
| Mean | 52.2% | 25.6% |
| Median | 51.6% | 27.2% |
| Interquartile 25% (IQ1) | 44.2% | 21.3% |
| Interquartile 75% (IQ3) | 55.7% | 30.2% |
| Interquartile Range (IQR) | 11.4% | 8.8% |
| Standard Deviation (Sample) | 14.3% | 7.3% |
| Standard Deviation (Population) | 14.2% | 7.3% |
Similar Demographics by In Labor Force | Age 16-19
Demographics Similar to Germans by In Labor Force | Age 16-19
In terms of in labor force | age 16-19, the demographic groups most similar to Germans are Swedish (44.1%, a difference of 0.080%), Finnish (43.9%, a difference of 0.54%), Dutch (43.8%, a difference of 0.73%), Cape Verdean (44.5%, a difference of 0.74%), and Chippewa (43.8%, a difference of 0.83%).
| Demographics | Rating | Rank | In Labor Force | Age 16-19 |
| Immigrants | Somalia | 100.0 /100 | #3 | Exceptional 45.6% |
| Luxembourgers | 100.0 /100 | #4 | Exceptional 45.3% |
| Alaskan Athabascans | 100.0 /100 | #5 | Exceptional 45.2% |
| Somalis | 100.0 /100 | #6 | Exceptional 45.1% |
| Danes | 100.0 /100 | #7 | Exceptional 44.7% |
| Immigrants | Cabo Verde | 100.0 /100 | #8 | Exceptional 44.7% |
| Cape Verdeans | 100.0 /100 | #9 | Exceptional 44.5% |
| Germans | 100.0 /100 | #10 | Exceptional 44.2% |
| Swedes | 100.0 /100 | #11 | Exceptional 44.1% |
| Finns | 100.0 /100 | #12 | Exceptional 43.9% |
| Dutch | 100.0 /100 | #13 | Exceptional 43.8% |
| Chippewa | 100.0 /100 | #14 | Exceptional 43.8% |
| Slovenes | 100.0 /100 | #15 | Exceptional 43.7% |
| Czechs | 100.0 /100 | #16 | Exceptional 43.6% |
| Scandinavians | 100.0 /100 | #17 | Exceptional 43.6% |
Demographics Similar to Immigrants from China by In Labor Force | Age 16-19
In terms of in labor force | age 16-19, the demographic groups most similar to Immigrants from China are Dominican (31.2%, a difference of 0.15%), Immigrants from Dominican Republic (31.1%, a difference of 0.20%), Immigrants from Caribbean (31.2%, a difference of 0.33%), Immigrants from Taiwan (31.0%, a difference of 0.36%), and Immigrants from Ecuador (31.0%, a difference of 0.40%).
| Demographics | Rating | Rank | In Labor Force | Age 16-19 |
| Immigrants | Yemen | 0.0 /100 | #318 | Tragic 31.5% |
| Soviet Union | 0.0 /100 | #319 | Tragic 31.4% |
| Ecuadorians | 0.0 /100 | #320 | Tragic 31.4% |
| West Indians | 0.0 /100 | #321 | Tragic 31.3% |
| Tohono O'odham | 0.0 /100 | #322 | Tragic 31.3% |
| Immigrants | Caribbean | 0.0 /100 | #323 | Tragic 31.2% |
| Dominicans | 0.0 /100 | #324 | Tragic 31.2% |
| Immigrants | China | 0.0 /100 | #325 | Tragic 31.1% |
| Immigrants | Dominican Republic | 0.0 /100 | #326 | Tragic 31.1% |
| Immigrants | Taiwan | 0.0 /100 | #327 | Tragic 31.0% |
| Immigrants | Ecuador | 0.0 /100 | #328 | Tragic 31.0% |
| Barbadians | 0.0 /100 | #329 | Tragic 31.0% |
| Lumbee | 0.0 /100 | #330 | Tragic 31.0% |
| Trinidadians and Tobagonians | 0.0 /100 | #331 | Tragic 30.9% |
| Immigrants | Israel | 0.0 /100 | #332 | Tragic 30.5% |