Immigrants from Iran vs Immigrants from Argentina Bachelor's Degree
COMPARE
Immigrants from Iran
Immigrants from Argentina
Bachelor's Degree
Bachelor's Degree Comparison
Immigrants from Iran
Immigrants from Argentina
50.3%
BACHELOR'S DEGREE
100.0/ 100
METRIC RATING
7th/ 347
METRIC RANK
42.8%
BACHELOR'S DEGREE
99.6/ 100
METRIC RATING
71st/ 347
METRIC RANK
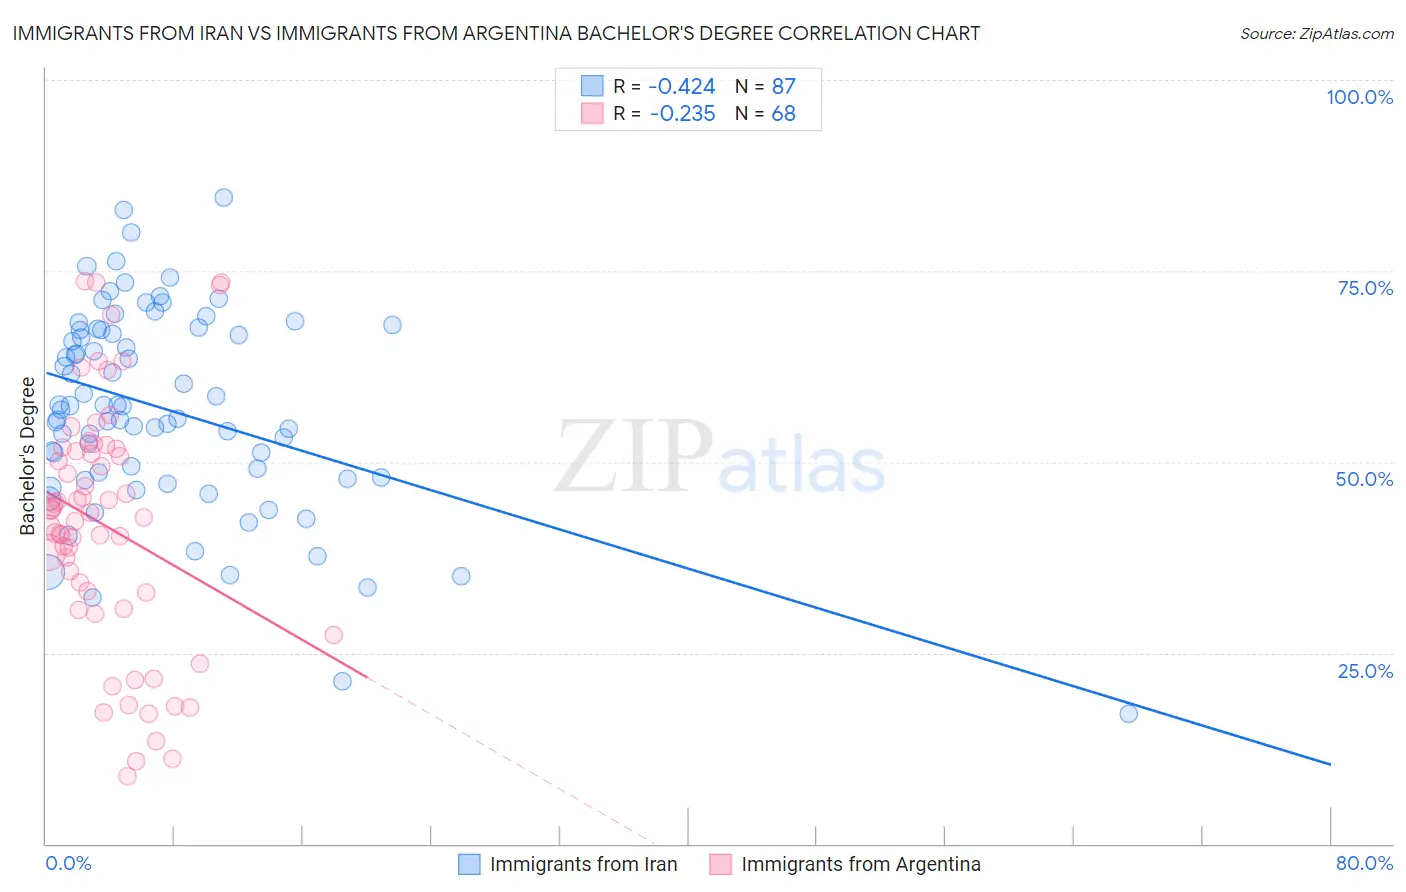
Immigrants from Iran vs Immigrants from Argentina Bachelor's Degree Correlation Chart
The statistical analysis conducted on geographies consisting of 279,901,674 people shows a moderate negative correlation between the proportion of Immigrants from Iran and percentage of population with at least bachelor's degree education in the United States with a correlation coefficient (R) of -0.424 and weighted average of 50.3%. Similarly, the statistical analysis conducted on geographies consisting of 264,417,029 people shows a weak negative correlation between the proportion of Immigrants from Argentina and percentage of population with at least bachelor's degree education in the United States with a correlation coefficient (R) of -0.235 and weighted average of 42.8%, a difference of 17.5%.
Bachelor's Degree Correlation Summary
| Measurement | Immigrants from Iran | Immigrants from Argentina |
| Minimum | 17.0% | 8.8% |
| Maximum | 84.6% | 73.6% |
| Range | 67.5% | 64.8% |
| Mean | 56.9% | 41.6% |
| Median | 57.3% | 43.1% |
| Interquartile 25% (IQ1) | 47.9% | 31.8% |
| Interquartile 75% (IQ3) | 67.3% | 51.5% |
| Interquartile Range (IQR) | 19.3% | 19.8% |
| Standard Deviation (Sample) | 13.2% | 16.1% |
| Standard Deviation (Population) | 13.1% | 16.0% |
Similar Demographics by Bachelor's Degree
Demographics Similar to Immigrants from Iran by Bachelor's Degree
In terms of bachelor's degree, the demographic groups most similar to Immigrants from Iran are Thai (50.1%, a difference of 0.37%), Okinawan (50.5%, a difference of 0.48%), Immigrants from Israel (50.0%, a difference of 0.61%), Iranian (51.0%, a difference of 1.3%), and Immigrants from Taiwan (51.2%, a difference of 1.7%).
| Demographics | Rating | Rank | Bachelor's Degree |
| Filipinos | 100.0 /100 | #1 | Exceptional 52.7% |
| Immigrants | Singapore | 100.0 /100 | #2 | Exceptional 51.9% |
| Immigrants | India | 100.0 /100 | #3 | Exceptional 51.3% |
| Immigrants | Taiwan | 100.0 /100 | #4 | Exceptional 51.2% |
| Iranians | 100.0 /100 | #5 | Exceptional 51.0% |
| Okinawans | 100.0 /100 | #6 | Exceptional 50.5% |
| Immigrants | Iran | 100.0 /100 | #7 | Exceptional 50.3% |
| Thais | 100.0 /100 | #8 | Exceptional 50.1% |
| Immigrants | Israel | 100.0 /100 | #9 | Exceptional 50.0% |
| Cypriots | 100.0 /100 | #10 | Exceptional 49.0% |
| Immigrants | Australia | 100.0 /100 | #11 | Exceptional 48.5% |
| Immigrants | China | 100.0 /100 | #12 | Exceptional 48.4% |
| Immigrants | South Central Asia | 100.0 /100 | #13 | Exceptional 48.3% |
| Immigrants | Hong Kong | 100.0 /100 | #14 | Exceptional 48.2% |
| Immigrants | Eastern Asia | 100.0 /100 | #15 | Exceptional 48.1% |
Demographics Similar to Immigrants from Argentina by Bachelor's Degree
In terms of bachelor's degree, the demographic groups most similar to Immigrants from Argentina are Ethiopian (42.8%, a difference of 0.090%), Immigrants from Uzbekistan (42.8%, a difference of 0.14%), Immigrants from Romania (42.9%, a difference of 0.26%), Bhutanese (42.7%, a difference of 0.36%), and Immigrants from Zimbabwe (42.6%, a difference of 0.58%).
| Demographics | Rating | Rank | Bachelor's Degree |
| Argentineans | 99.7 /100 | #64 | Exceptional 43.3% |
| Zimbabweans | 99.7 /100 | #65 | Exceptional 43.3% |
| Immigrants | Netherlands | 99.7 /100 | #66 | Exceptional 43.3% |
| Egyptians | 99.7 /100 | #67 | Exceptional 43.3% |
| Immigrants | Indonesia | 99.7 /100 | #68 | Exceptional 43.3% |
| Immigrants | Pakistan | 99.7 /100 | #69 | Exceptional 43.1% |
| Immigrants | Romania | 99.6 /100 | #70 | Exceptional 42.9% |
| Immigrants | Argentina | 99.6 /100 | #71 | Exceptional 42.8% |
| Ethiopians | 99.5 /100 | #72 | Exceptional 42.8% |
| Immigrants | Uzbekistan | 99.5 /100 | #73 | Exceptional 42.8% |
| Bhutanese | 99.5 /100 | #74 | Exceptional 42.7% |
| Immigrants | Zimbabwe | 99.4 /100 | #75 | Exceptional 42.6% |
| Immigrants | Egypt | 99.4 /100 | #76 | Exceptional 42.6% |
| Immigrants | Eastern Europe | 99.4 /100 | #77 | Exceptional 42.5% |
| Immigrants | Ethiopia | 99.4 /100 | #78 | Exceptional 42.5% |