Immigrants from Turkey vs Immigrants from Argentina In Labor Force | Age 20-24
COMPARE
Immigrants from Turkey
Immigrants from Argentina
In Labor Force | Age 20-24
In Labor Force | Age 20-24 Comparison
Immigrants from Turkey
Immigrants from Argentina
73.7%
IN LABOR FORCE | AGE 20-24
0.7/ 100
METRIC RATING
260th/ 347
METRIC RANK
72.8%
IN LABOR FORCE | AGE 20-24
0.0/ 100
METRIC RATING
294th/ 347
METRIC RANK
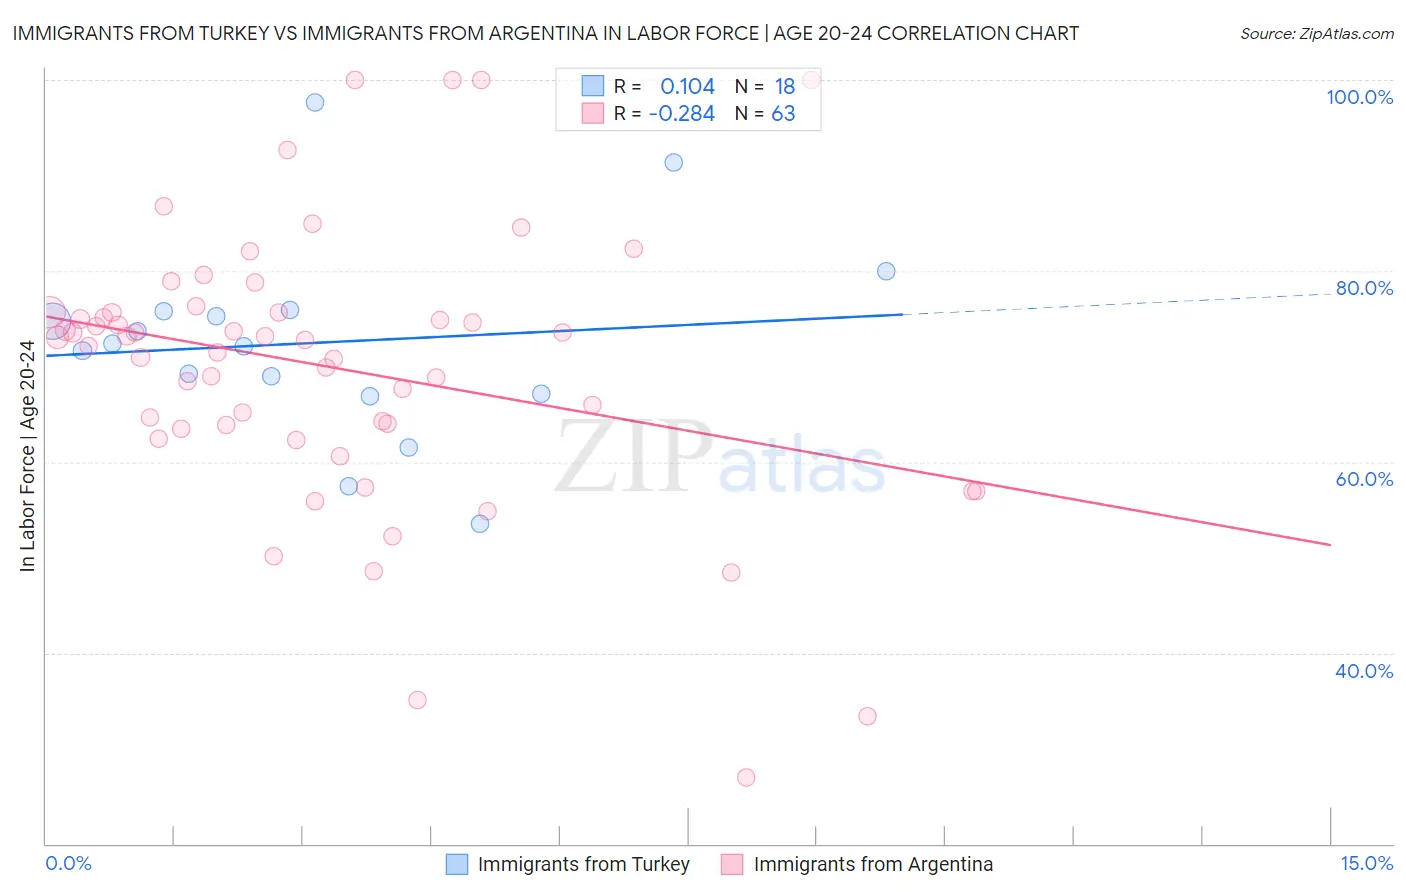
Immigrants from Turkey vs Immigrants from Argentina In Labor Force | Age 20-24 Correlation Chart
The statistical analysis conducted on geographies consisting of 223,027,856 people shows a poor positive correlation between the proportion of Immigrants from Turkey and labor force participation rate among population between the ages 20 and 24 in the United States with a correlation coefficient (R) of 0.104 and weighted average of 73.7%. Similarly, the statistical analysis conducted on geographies consisting of 264,369,476 people shows a weak negative correlation between the proportion of Immigrants from Argentina and labor force participation rate among population between the ages 20 and 24 in the United States with a correlation coefficient (R) of -0.284 and weighted average of 72.8%, a difference of 1.2%.
In Labor Force | Age 20-24 Correlation Summary
| Measurement | Immigrants from Turkey | Immigrants from Argentina |
| Minimum | 53.5% | 26.9% |
| Maximum | 97.7% | 100.0% |
| Range | 44.2% | 73.1% |
| Mean | 72.5% | 69.9% |
| Median | 72.2% | 72.8% |
| Interquartile 25% (IQ1) | 67.1% | 63.5% |
| Interquartile 75% (IQ3) | 75.7% | 75.7% |
| Interquartile Range (IQR) | 8.6% | 12.2% |
| Standard Deviation (Sample) | 10.5% | 14.6% |
| Standard Deviation (Population) | 10.2% | 14.5% |
Similar Demographics by In Labor Force | Age 20-24
Demographics Similar to Immigrants from Turkey by In Labor Force | Age 20-24
In terms of in labor force | age 20-24, the demographic groups most similar to Immigrants from Turkey are Houma (73.7%, a difference of 0.010%), Asian (73.7%, a difference of 0.020%), Egyptian (73.7%, a difference of 0.030%), Dutch West Indian (73.7%, a difference of 0.030%), and Paraguayan (73.7%, a difference of 0.070%).
| Demographics | Rating | Rank | In Labor Force | Age 20-24 |
| Arapaho | 1.0 /100 | #253 | Tragic 73.8% |
| Ute | 1.0 /100 | #254 | Tragic 73.8% |
| Immigrants | Pakistan | 0.9 /100 | #255 | Tragic 73.8% |
| Spanish American Indians | 0.8 /100 | #256 | Tragic 73.7% |
| Paraguayans | 0.8 /100 | #257 | Tragic 73.7% |
| Egyptians | 0.7 /100 | #258 | Tragic 73.7% |
| Dutch West Indians | 0.7 /100 | #259 | Tragic 73.7% |
| Immigrants | Turkey | 0.7 /100 | #260 | Tragic 73.7% |
| Houma | 0.6 /100 | #261 | Tragic 73.7% |
| Asians | 0.6 /100 | #262 | Tragic 73.7% |
| Immigrants | Asia | 0.5 /100 | #263 | Tragic 73.6% |
| Immigrants | Haiti | 0.5 /100 | #264 | Tragic 73.6% |
| Burmese | 0.5 /100 | #265 | Tragic 73.6% |
| Haitians | 0.5 /100 | #266 | Tragic 73.6% |
| Immigrants | Western Asia | 0.4 /100 | #267 | Tragic 73.5% |
Demographics Similar to Immigrants from Argentina by In Labor Force | Age 20-24
In terms of in labor force | age 20-24, the demographic groups most similar to Immigrants from Argentina are Immigrants from Belize (72.8%, a difference of 0.030%), Pueblo (72.9%, a difference of 0.090%), Okinawan (72.7%, a difference of 0.11%), Jamaican (72.7%, a difference of 0.11%), and Central American Indian (72.7%, a difference of 0.16%).
| Demographics | Rating | Rank | In Labor Force | Age 20-24 |
| Immigrants | Korea | 0.1 /100 | #287 | Tragic 73.1% |
| Argentineans | 0.1 /100 | #288 | Tragic 73.1% |
| U.S. Virgin Islanders | 0.1 /100 | #289 | Tragic 73.0% |
| Immigrants | Belarus | 0.1 /100 | #290 | Tragic 73.0% |
| Immigrants | Nicaragua | 0.0 /100 | #291 | Tragic 72.9% |
| Pueblo | 0.0 /100 | #292 | Tragic 72.9% |
| Immigrants | Belize | 0.0 /100 | #293 | Tragic 72.8% |
| Immigrants | Argentina | 0.0 /100 | #294 | Tragic 72.8% |
| Okinawans | 0.0 /100 | #295 | Tragic 72.7% |
| Jamaicans | 0.0 /100 | #296 | Tragic 72.7% |
| Central American Indians | 0.0 /100 | #297 | Tragic 72.7% |
| Israelis | 0.0 /100 | #298 | Tragic 72.6% |
| Iranians | 0.0 /100 | #299 | Tragic 72.6% |
| Armenians | 0.0 /100 | #300 | Tragic 72.5% |
| Cubans | 0.0 /100 | #301 | Tragic 72.5% |