Immigrants from India vs Inupiat In Labor Force | Age 25-29
COMPARE
Immigrants from India
Inupiat
In Labor Force | Age 25-29
In Labor Force | Age 25-29 Comparison
Immigrants from India
Inupiat
85.7%
IN LABOR FORCE | AGE 25-29
99.9/ 100
METRIC RATING
43rd/ 347
METRIC RANK
79.8%
IN LABOR FORCE | AGE 25-29
0.0/ 100
METRIC RATING
332nd/ 347
METRIC RANK
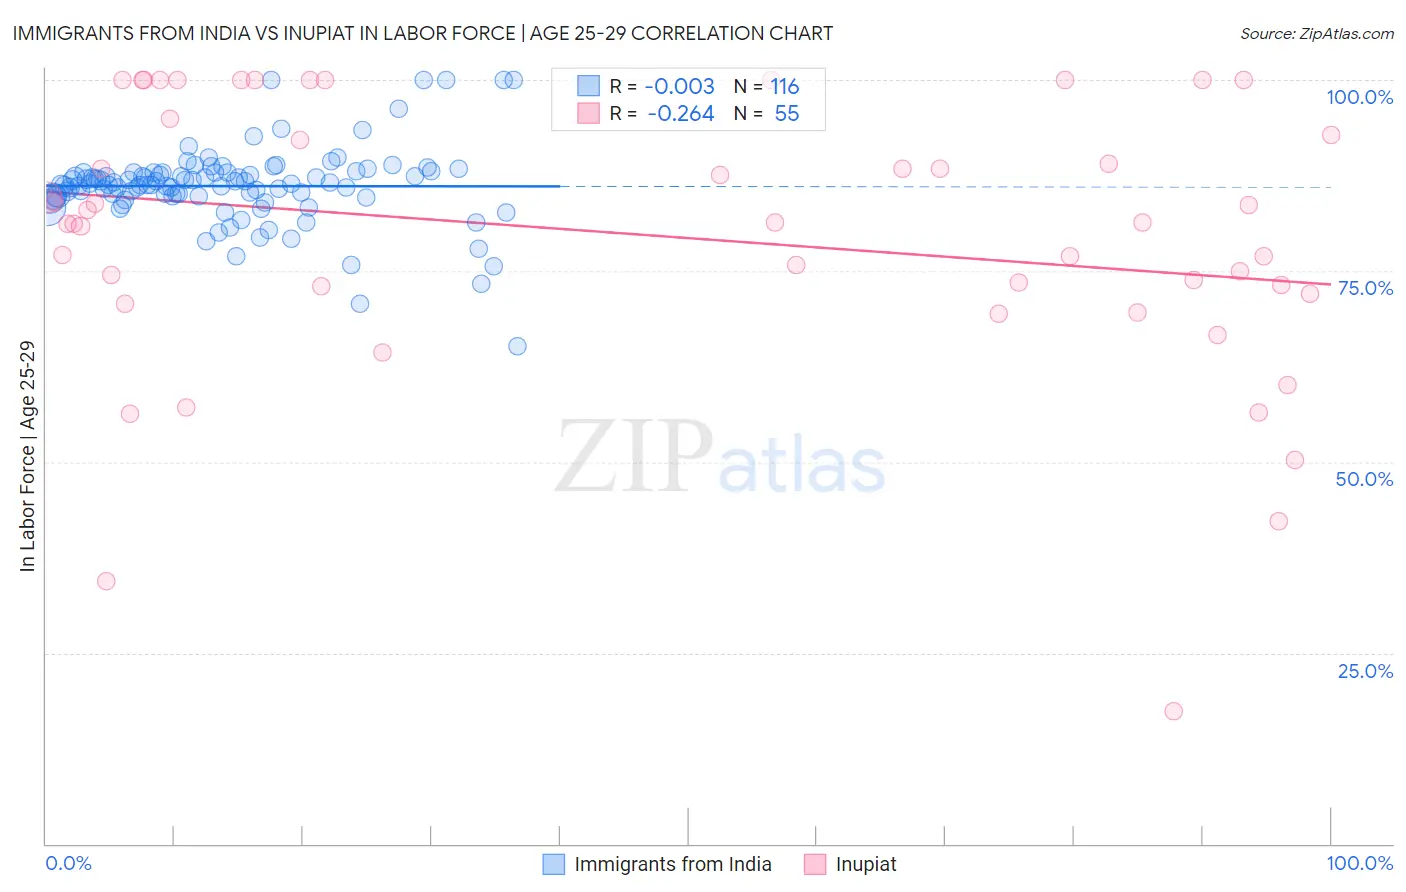
Immigrants from India vs Inupiat In Labor Force | Age 25-29 Correlation Chart
The statistical analysis conducted on geographies consisting of 433,894,506 people shows no correlation between the proportion of Immigrants from India and labor force participation rate among population between the ages 25 and 29 in the United States with a correlation coefficient (R) of -0.003 and weighted average of 85.7%. Similarly, the statistical analysis conducted on geographies consisting of 96,328,629 people shows a weak negative correlation between the proportion of Inupiat and labor force participation rate among population between the ages 25 and 29 in the United States with a correlation coefficient (R) of -0.264 and weighted average of 79.8%, a difference of 7.4%.
In Labor Force | Age 25-29 Correlation Summary
| Measurement | Immigrants from India | Inupiat |
| Minimum | 65.2% | 17.4% |
| Maximum | 100.0% | 100.0% |
| Range | 34.8% | 82.6% |
| Mean | 86.1% | 79.7% |
| Median | 86.3% | 81.3% |
| Interquartile 25% (IQ1) | 84.8% | 72.0% |
| Interquartile 75% (IQ3) | 87.8% | 94.9% |
| Interquartile Range (IQR) | 3.0% | 22.9% |
| Standard Deviation (Sample) | 5.1% | 18.0% |
| Standard Deviation (Population) | 5.1% | 17.9% |
Similar Demographics by In Labor Force | Age 25-29
Demographics Similar to Immigrants from India by In Labor Force | Age 25-29
In terms of in labor force | age 25-29, the demographic groups most similar to Immigrants from India are Immigrants from Eritrea (85.7%, a difference of 0.010%), Macedonian (85.7%, a difference of 0.010%), Immigrants from Sierra Leone (85.7%, a difference of 0.010%), Czech (85.6%, a difference of 0.040%), and Immigrants from Greece (85.7%, a difference of 0.050%).
| Demographics | Rating | Rank | In Labor Force | Age 25-29 |
| Immigrants | Nepal | 99.9 /100 | #36 | Exceptional 85.8% |
| Poles | 99.9 /100 | #37 | Exceptional 85.8% |
| Sierra Leoneans | 99.9 /100 | #38 | Exceptional 85.8% |
| Croatians | 99.9 /100 | #39 | Exceptional 85.8% |
| Immigrants | Albania | 99.9 /100 | #40 | Exceptional 85.7% |
| Immigrants | Greece | 99.9 /100 | #41 | Exceptional 85.7% |
| Immigrants | Eritrea | 99.9 /100 | #42 | Exceptional 85.7% |
| Immigrants | India | 99.9 /100 | #43 | Exceptional 85.7% |
| Macedonians | 99.9 /100 | #44 | Exceptional 85.7% |
| Immigrants | Sierra Leone | 99.9 /100 | #45 | Exceptional 85.7% |
| Czechs | 99.8 /100 | #46 | Exceptional 85.6% |
| Turks | 99.8 /100 | #47 | Exceptional 85.6% |
| Italians | 99.8 /100 | #48 | Exceptional 85.6% |
| Swedes | 99.8 /100 | #49 | Exceptional 85.6% |
| Yugoslavians | 99.8 /100 | #50 | Exceptional 85.6% |
Demographics Similar to Inupiat by In Labor Force | Age 25-29
In terms of in labor force | age 25-29, the demographic groups most similar to Inupiat are Sioux (79.7%, a difference of 0.11%), Yuman (79.3%, a difference of 0.53%), Native/Alaskan (79.3%, a difference of 0.61%), Apache (79.2%, a difference of 0.68%), and Cheyenne (80.3%, a difference of 0.69%).
| Demographics | Rating | Rank | In Labor Force | Age 25-29 |
| Dutch West Indians | 0.0 /100 | #325 | Tragic 81.1% |
| Choctaw | 0.0 /100 | #326 | Tragic 81.0% |
| Ute | 0.0 /100 | #327 | Tragic 80.8% |
| Creek | 0.0 /100 | #328 | Tragic 80.7% |
| Yakama | 0.0 /100 | #329 | Tragic 80.6% |
| Puerto Ricans | 0.0 /100 | #330 | Tragic 80.4% |
| Cheyenne | 0.0 /100 | #331 | Tragic 80.3% |
| Inupiat | 0.0 /100 | #332 | Tragic 79.8% |
| Sioux | 0.0 /100 | #333 | Tragic 79.7% |
| Yuman | 0.0 /100 | #334 | Tragic 79.3% |
| Natives/Alaskans | 0.0 /100 | #335 | Tragic 79.3% |
| Apache | 0.0 /100 | #336 | Tragic 79.2% |
| Crow | 0.0 /100 | #337 | Tragic 78.6% |
| Lumbee | 0.0 /100 | #338 | Tragic 78.3% |
| Immigrants | Yemen | 0.0 /100 | #339 | Tragic 78.2% |