Malaysian vs Inupiat In Labor Force | Age 25-29
COMPARE
Malaysian
Inupiat
In Labor Force | Age 25-29
In Labor Force | Age 25-29 Comparison
Malaysians
Inupiat
84.6%
IN LABOR FORCE | AGE 25-29
46.8/ 100
METRIC RATING
176th/ 347
METRIC RANK
79.8%
IN LABOR FORCE | AGE 25-29
0.0/ 100
METRIC RATING
332nd/ 347
METRIC RANK
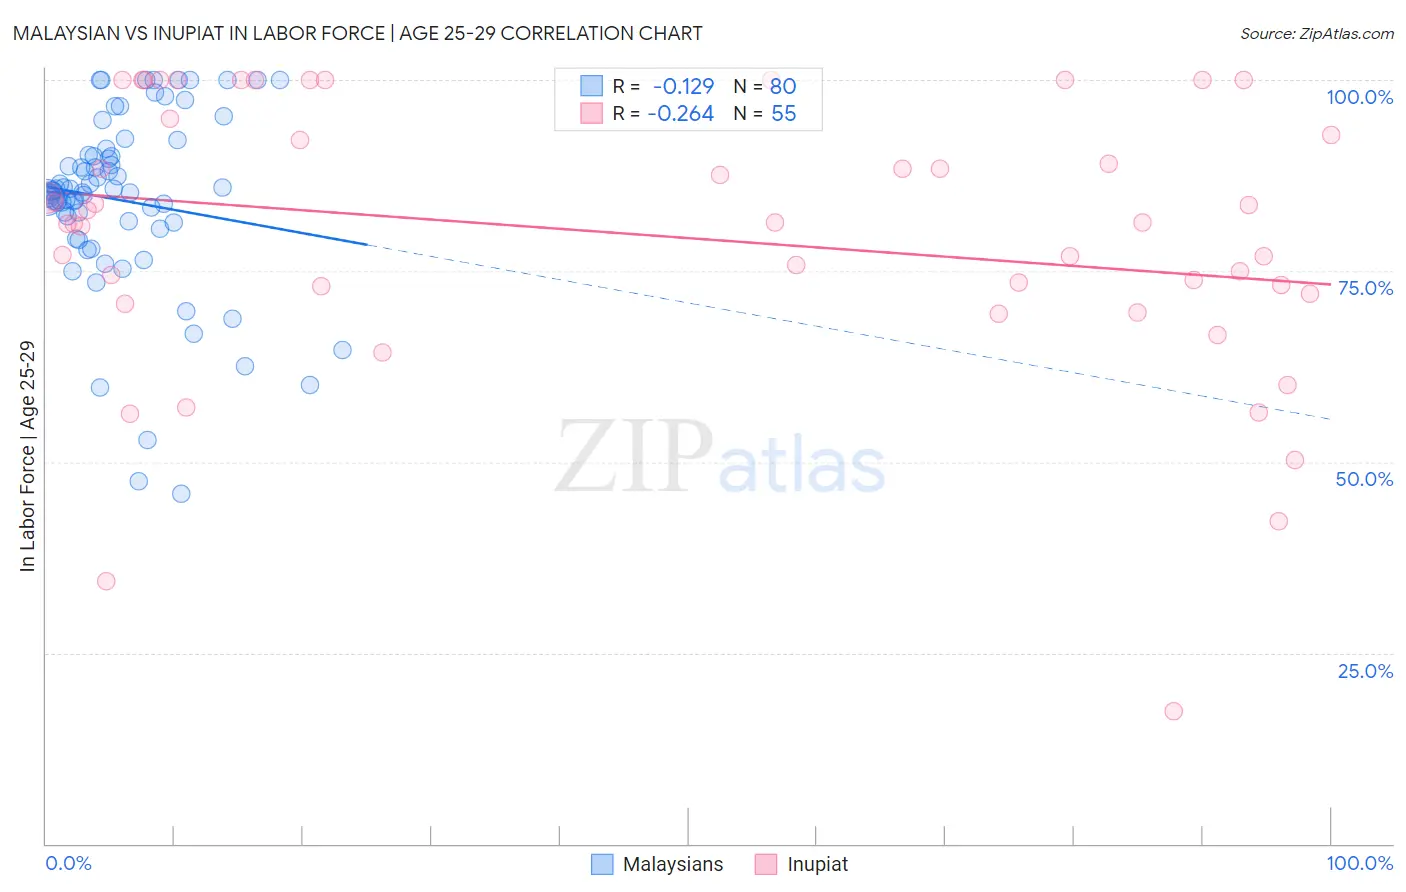
Malaysian vs Inupiat In Labor Force | Age 25-29 Correlation Chart
The statistical analysis conducted on geographies consisting of 226,081,957 people shows a poor negative correlation between the proportion of Malaysians and labor force participation rate among population between the ages 25 and 29 in the United States with a correlation coefficient (R) of -0.129 and weighted average of 84.6%. Similarly, the statistical analysis conducted on geographies consisting of 96,328,629 people shows a weak negative correlation between the proportion of Inupiat and labor force participation rate among population between the ages 25 and 29 in the United States with a correlation coefficient (R) of -0.264 and weighted average of 79.8%, a difference of 6.1%.
In Labor Force | Age 25-29 Correlation Summary
| Measurement | Malaysian | Inupiat |
| Minimum | 45.8% | 17.4% |
| Maximum | 100.0% | 100.0% |
| Range | 54.2% | 82.6% |
| Mean | 84.2% | 79.7% |
| Median | 85.4% | 81.3% |
| Interquartile 25% (IQ1) | 80.9% | 72.0% |
| Interquartile 75% (IQ3) | 90.1% | 94.9% |
| Interquartile Range (IQR) | 9.2% | 22.9% |
| Standard Deviation (Sample) | 11.8% | 18.0% |
| Standard Deviation (Population) | 11.7% | 17.9% |
Similar Demographics by In Labor Force | Age 25-29
Demographics Similar to Malaysians by In Labor Force | Age 25-29
In terms of in labor force | age 25-29, the demographic groups most similar to Malaysians are Hungarian (84.6%, a difference of 0.010%), Immigrants from China (84.6%, a difference of 0.010%), Immigrants from Thailand (84.6%, a difference of 0.010%), Assyrian/Chaldean/Syriac (84.7%, a difference of 0.020%), and Palestinian (84.7%, a difference of 0.020%).
| Demographics | Rating | Rank | In Labor Force | Age 25-29 |
| Celtics | 52.5 /100 | #169 | Average 84.7% |
| Tongans | 52.4 /100 | #170 | Average 84.7% |
| Immigrants | Vietnam | 50.5 /100 | #171 | Average 84.7% |
| Immigrants | Western Europe | 50.4 /100 | #172 | Average 84.7% |
| Assyrians/Chaldeans/Syriacs | 50.2 /100 | #173 | Average 84.7% |
| Palestinians | 50.0 /100 | #174 | Average 84.7% |
| Hungarians | 47.8 /100 | #175 | Average 84.6% |
| Malaysians | 46.8 /100 | #176 | Average 84.6% |
| Immigrants | China | 45.7 /100 | #177 | Average 84.6% |
| Immigrants | Thailand | 45.2 /100 | #178 | Average 84.6% |
| Immigrants | Argentina | 44.0 /100 | #179 | Average 84.6% |
| Immigrants | South America | 42.9 /100 | #180 | Average 84.6% |
| Immigrants | Norway | 41.9 /100 | #181 | Average 84.6% |
| Europeans | 40.3 /100 | #182 | Average 84.6% |
| Scottish | 40.1 /100 | #183 | Average 84.6% |
Demographics Similar to Inupiat by In Labor Force | Age 25-29
In terms of in labor force | age 25-29, the demographic groups most similar to Inupiat are Sioux (79.7%, a difference of 0.11%), Yuman (79.3%, a difference of 0.53%), Native/Alaskan (79.3%, a difference of 0.61%), Apache (79.2%, a difference of 0.68%), and Cheyenne (80.3%, a difference of 0.69%).
| Demographics | Rating | Rank | In Labor Force | Age 25-29 |
| Dutch West Indians | 0.0 /100 | #325 | Tragic 81.1% |
| Choctaw | 0.0 /100 | #326 | Tragic 81.0% |
| Ute | 0.0 /100 | #327 | Tragic 80.8% |
| Creek | 0.0 /100 | #328 | Tragic 80.7% |
| Yakama | 0.0 /100 | #329 | Tragic 80.6% |
| Puerto Ricans | 0.0 /100 | #330 | Tragic 80.4% |
| Cheyenne | 0.0 /100 | #331 | Tragic 80.3% |
| Inupiat | 0.0 /100 | #332 | Tragic 79.8% |
| Sioux | 0.0 /100 | #333 | Tragic 79.7% |
| Yuman | 0.0 /100 | #334 | Tragic 79.3% |
| Natives/Alaskans | 0.0 /100 | #335 | Tragic 79.3% |
| Apache | 0.0 /100 | #336 | Tragic 79.2% |
| Crow | 0.0 /100 | #337 | Tragic 78.6% |
| Lumbee | 0.0 /100 | #338 | Tragic 78.3% |
| Immigrants | Yemen | 0.0 /100 | #339 | Tragic 78.2% |