Swiss vs Inupiat In Labor Force | Age 25-29
COMPARE
Swiss
Inupiat
In Labor Force | Age 25-29
In Labor Force | Age 25-29 Comparison
Swiss
Inupiat
84.7%
IN LABOR FORCE | AGE 25-29
64.7/ 100
METRIC RATING
150th/ 347
METRIC RANK
79.8%
IN LABOR FORCE | AGE 25-29
0.0/ 100
METRIC RATING
332nd/ 347
METRIC RANK
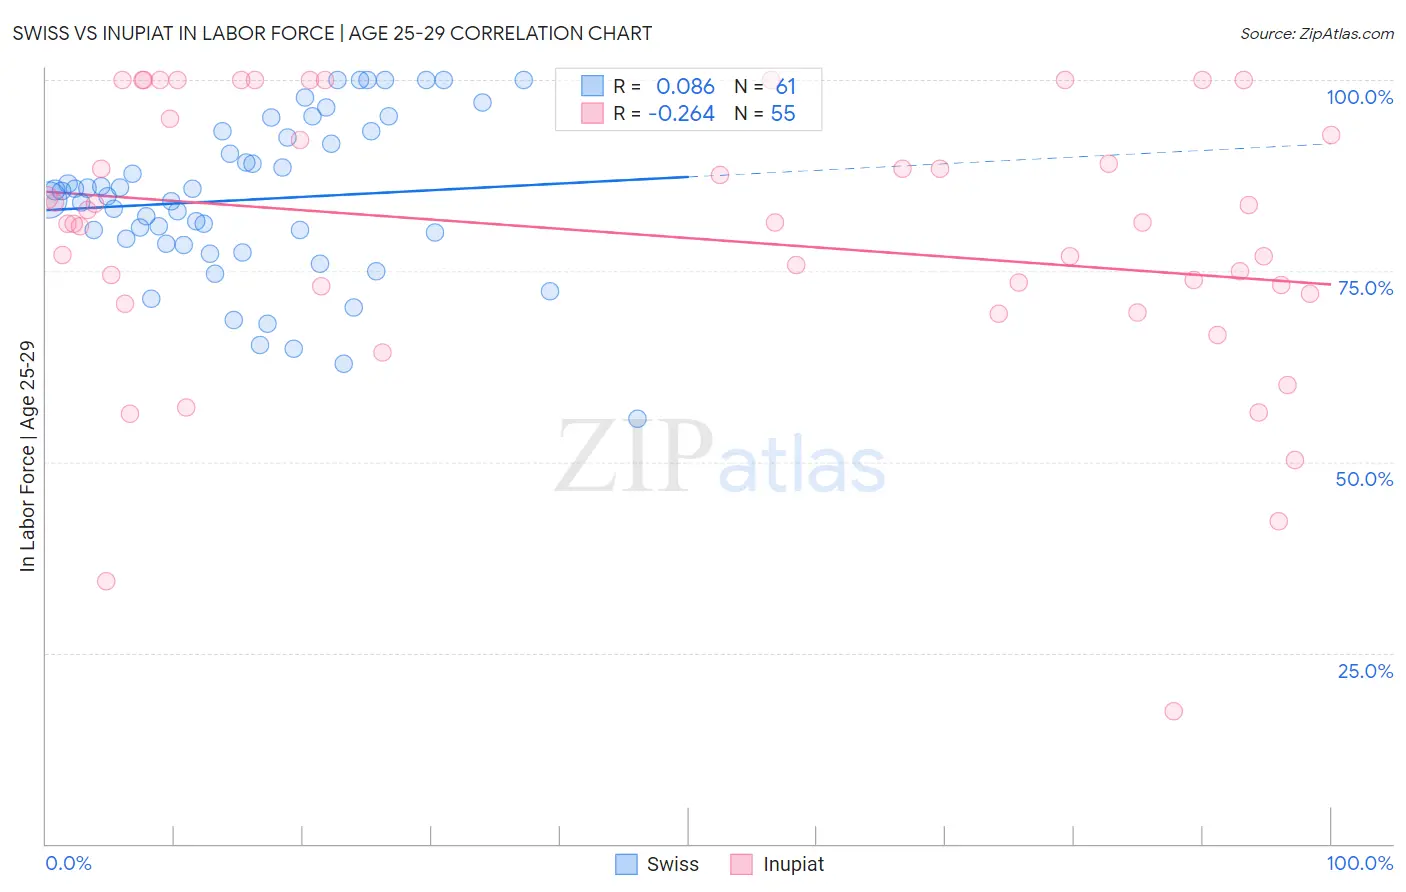
Swiss vs Inupiat In Labor Force | Age 25-29 Correlation Chart
The statistical analysis conducted on geographies consisting of 464,613,685 people shows a slight positive correlation between the proportion of Swiss and labor force participation rate among population between the ages 25 and 29 in the United States with a correlation coefficient (R) of 0.086 and weighted average of 84.7%. Similarly, the statistical analysis conducted on geographies consisting of 96,328,629 people shows a weak negative correlation between the proportion of Inupiat and labor force participation rate among population between the ages 25 and 29 in the United States with a correlation coefficient (R) of -0.264 and weighted average of 79.8%, a difference of 6.3%.
In Labor Force | Age 25-29 Correlation Summary
| Measurement | Swiss | Inupiat |
| Minimum | 55.6% | 17.4% |
| Maximum | 100.0% | 100.0% |
| Range | 44.4% | 82.6% |
| Mean | 84.4% | 79.7% |
| Median | 84.8% | 81.3% |
| Interquartile 25% (IQ1) | 78.5% | 72.0% |
| Interquartile 75% (IQ3) | 92.9% | 94.9% |
| Interquartile Range (IQR) | 14.4% | 22.9% |
| Standard Deviation (Sample) | 10.5% | 18.0% |
| Standard Deviation (Population) | 10.4% | 17.9% |
Similar Demographics by In Labor Force | Age 25-29
Demographics Similar to Swiss by In Labor Force | Age 25-29
In terms of in labor force | age 25-29, the demographic groups most similar to Swiss are Immigrants from England (84.7%, a difference of 0.0%), Peruvian (84.7%, a difference of 0.0%), Colombian (84.7%, a difference of 0.010%), Immigrants from Pakistan (84.7%, a difference of 0.020%), and Immigrants from Taiwan (84.7%, a difference of 0.020%).
| Demographics | Rating | Rank | In Labor Force | Age 25-29 |
| Sri Lankans | 69.2 /100 | #143 | Good 84.8% |
| Immigrants | Laos | 69.0 /100 | #144 | Good 84.8% |
| Immigrants | Senegal | 68.3 /100 | #145 | Good 84.8% |
| Icelanders | 68.2 /100 | #146 | Good 84.8% |
| Immigrants | Asia | 68.2 /100 | #147 | Good 84.8% |
| Immigrants | England | 65.2 /100 | #148 | Good 84.7% |
| Peruvians | 64.7 /100 | #149 | Good 84.7% |
| Swiss | 64.7 /100 | #150 | Good 84.7% |
| Colombians | 62.8 /100 | #151 | Good 84.7% |
| Immigrants | Pakistan | 62.7 /100 | #152 | Good 84.7% |
| Immigrants | Taiwan | 62.2 /100 | #153 | Good 84.7% |
| Immigrants | Sri Lanka | 61.7 /100 | #154 | Good 84.7% |
| Indians (Asian) | 61.6 /100 | #155 | Good 84.7% |
| French | 61.0 /100 | #156 | Good 84.7% |
| British | 60.4 /100 | #157 | Good 84.7% |
Demographics Similar to Inupiat by In Labor Force | Age 25-29
In terms of in labor force | age 25-29, the demographic groups most similar to Inupiat are Sioux (79.7%, a difference of 0.11%), Yuman (79.3%, a difference of 0.53%), Native/Alaskan (79.3%, a difference of 0.61%), Apache (79.2%, a difference of 0.68%), and Cheyenne (80.3%, a difference of 0.69%).
| Demographics | Rating | Rank | In Labor Force | Age 25-29 |
| Dutch West Indians | 0.0 /100 | #325 | Tragic 81.1% |
| Choctaw | 0.0 /100 | #326 | Tragic 81.0% |
| Ute | 0.0 /100 | #327 | Tragic 80.8% |
| Creek | 0.0 /100 | #328 | Tragic 80.7% |
| Yakama | 0.0 /100 | #329 | Tragic 80.6% |
| Puerto Ricans | 0.0 /100 | #330 | Tragic 80.4% |
| Cheyenne | 0.0 /100 | #331 | Tragic 80.3% |
| Inupiat | 0.0 /100 | #332 | Tragic 79.8% |
| Sioux | 0.0 /100 | #333 | Tragic 79.7% |
| Yuman | 0.0 /100 | #334 | Tragic 79.3% |
| Natives/Alaskans | 0.0 /100 | #335 | Tragic 79.3% |
| Apache | 0.0 /100 | #336 | Tragic 79.2% |
| Crow | 0.0 /100 | #337 | Tragic 78.6% |
| Lumbee | 0.0 /100 | #338 | Tragic 78.3% |
| Immigrants | Yemen | 0.0 /100 | #339 | Tragic 78.2% |