Immigrants from India vs Asian In Labor Force | Age 25-29
COMPARE
Immigrants from India
Asian
In Labor Force | Age 25-29
In Labor Force | Age 25-29 Comparison
Immigrants from India
Asians
85.7%
IN LABOR FORCE | AGE 25-29
99.9/ 100
METRIC RATING
43rd/ 347
METRIC RANK
84.8%
IN LABOR FORCE | AGE 25-29
77.7/ 100
METRIC RATING
133rd/ 347
METRIC RANK
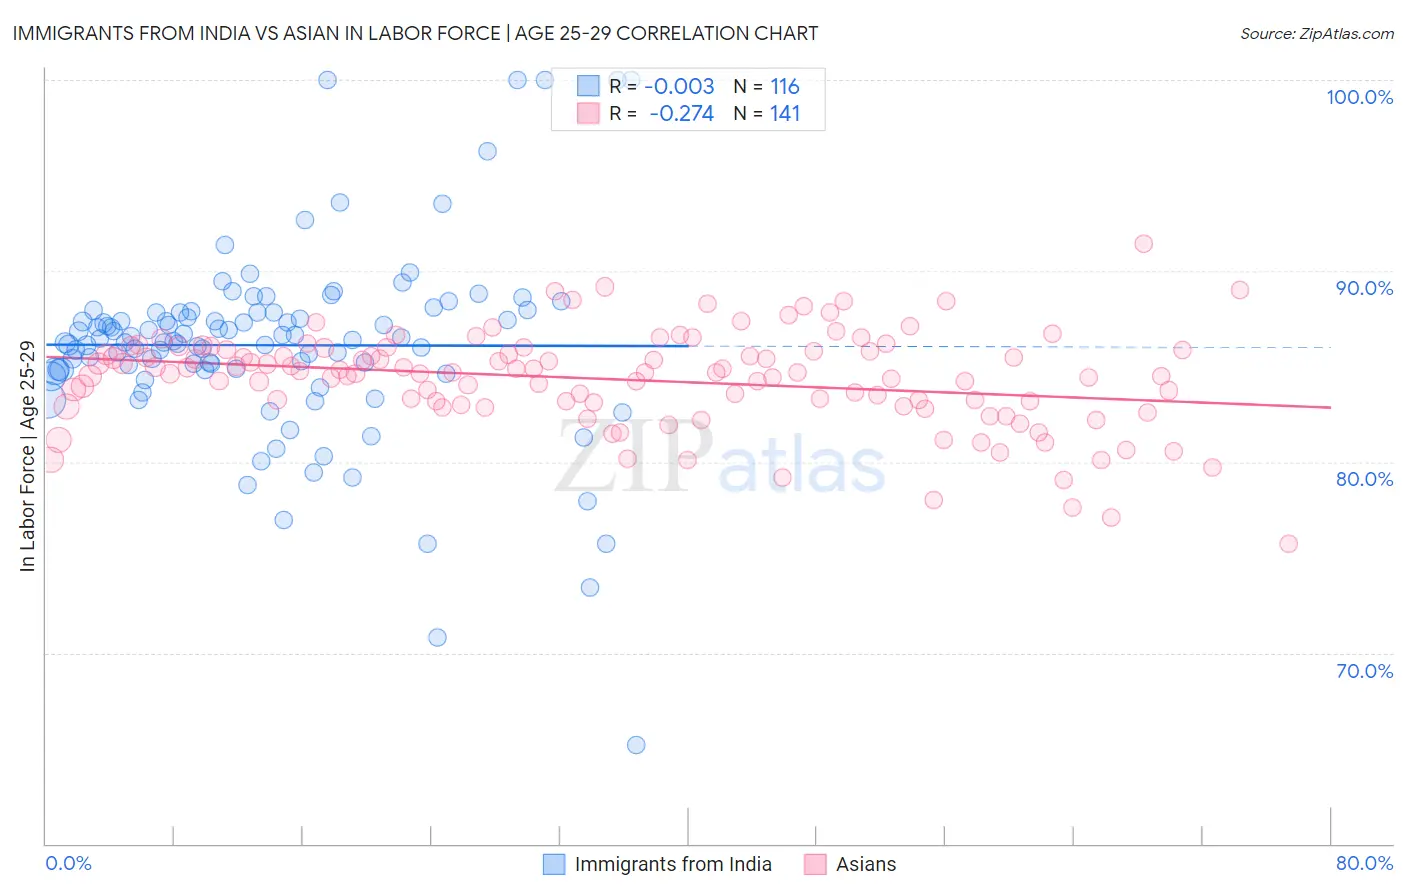
Immigrants from India vs Asian In Labor Force | Age 25-29 Correlation Chart
The statistical analysis conducted on geographies consisting of 433,894,506 people shows no correlation between the proportion of Immigrants from India and labor force participation rate among population between the ages 25 and 29 in the United States with a correlation coefficient (R) of -0.003 and weighted average of 85.7%. Similarly, the statistical analysis conducted on geographies consisting of 550,144,058 people shows a weak negative correlation between the proportion of Asians and labor force participation rate among population between the ages 25 and 29 in the United States with a correlation coefficient (R) of -0.274 and weighted average of 84.8%, a difference of 0.99%.
In Labor Force | Age 25-29 Correlation Summary
| Measurement | Immigrants from India | Asian |
| Minimum | 65.2% | 75.7% |
| Maximum | 100.0% | 91.4% |
| Range | 34.8% | 15.7% |
| Mean | 86.1% | 84.3% |
| Median | 86.3% | 84.7% |
| Interquartile 25% (IQ1) | 84.8% | 83.0% |
| Interquartile 75% (IQ3) | 87.8% | 85.9% |
| Interquartile Range (IQR) | 3.0% | 2.8% |
| Standard Deviation (Sample) | 5.1% | 2.5% |
| Standard Deviation (Population) | 5.1% | 2.5% |
Similar Demographics by In Labor Force | Age 25-29
Demographics Similar to Immigrants from India by In Labor Force | Age 25-29
In terms of in labor force | age 25-29, the demographic groups most similar to Immigrants from India are Immigrants from Eritrea (85.7%, a difference of 0.010%), Macedonian (85.7%, a difference of 0.010%), Immigrants from Sierra Leone (85.7%, a difference of 0.010%), Czech (85.6%, a difference of 0.040%), and Immigrants from Greece (85.7%, a difference of 0.050%).
| Demographics | Rating | Rank | In Labor Force | Age 25-29 |
| Immigrants | Nepal | 99.9 /100 | #36 | Exceptional 85.8% |
| Poles | 99.9 /100 | #37 | Exceptional 85.8% |
| Sierra Leoneans | 99.9 /100 | #38 | Exceptional 85.8% |
| Croatians | 99.9 /100 | #39 | Exceptional 85.8% |
| Immigrants | Albania | 99.9 /100 | #40 | Exceptional 85.7% |
| Immigrants | Greece | 99.9 /100 | #41 | Exceptional 85.7% |
| Immigrants | Eritrea | 99.9 /100 | #42 | Exceptional 85.7% |
| Immigrants | India | 99.9 /100 | #43 | Exceptional 85.7% |
| Macedonians | 99.9 /100 | #44 | Exceptional 85.7% |
| Immigrants | Sierra Leone | 99.9 /100 | #45 | Exceptional 85.7% |
| Czechs | 99.8 /100 | #46 | Exceptional 85.6% |
| Turks | 99.8 /100 | #47 | Exceptional 85.6% |
| Italians | 99.8 /100 | #48 | Exceptional 85.6% |
| Swedes | 99.8 /100 | #49 | Exceptional 85.6% |
| Yugoslavians | 99.8 /100 | #50 | Exceptional 85.6% |
Demographics Similar to Asians by In Labor Force | Age 25-29
In terms of in labor force | age 25-29, the demographic groups most similar to Asians are Iranian (84.8%, a difference of 0.0%), Romanian (84.8%, a difference of 0.0%), Syrian (84.8%, a difference of 0.010%), Immigrants from Hungary (84.8%, a difference of 0.010%), and Bhutanese (84.8%, a difference of 0.020%).
| Demographics | Rating | Rank | In Labor Force | Age 25-29 |
| Immigrants | Singapore | 84.4 /100 | #126 | Excellent 84.9% |
| Immigrants | Uruguay | 84.0 /100 | #127 | Excellent 84.9% |
| Australians | 83.6 /100 | #128 | Excellent 84.9% |
| Immigrants | Russia | 81.6 /100 | #129 | Excellent 84.9% |
| Northern Europeans | 81.3 /100 | #130 | Excellent 84.9% |
| Iranians | 78.1 /100 | #131 | Good 84.8% |
| Romanians | 77.7 /100 | #132 | Good 84.8% |
| Asians | 77.7 /100 | #133 | Good 84.8% |
| Syrians | 76.5 /100 | #134 | Good 84.8% |
| Immigrants | Hungary | 76.4 /100 | #135 | Good 84.8% |
| Bhutanese | 76.0 /100 | #136 | Good 84.8% |
| Immigrants | Canada | 73.5 /100 | #137 | Good 84.8% |
| Armenians | 72.7 /100 | #138 | Good 84.8% |
| Immigrants | Eastern Asia | 72.6 /100 | #139 | Good 84.8% |
| Immigrants | North America | 72.1 /100 | #140 | Good 84.8% |