Immigrants from India vs Alsatian In Labor Force | Age 25-29
COMPARE
Immigrants from India
Alsatian
In Labor Force | Age 25-29
In Labor Force | Age 25-29 Comparison
Immigrants from India
Alsatians
85.7%
IN LABOR FORCE | AGE 25-29
99.9/ 100
METRIC RATING
43rd/ 347
METRIC RANK
83.9%
IN LABOR FORCE | AGE 25-29
0.7/ 100
METRIC RATING
241st/ 347
METRIC RANK
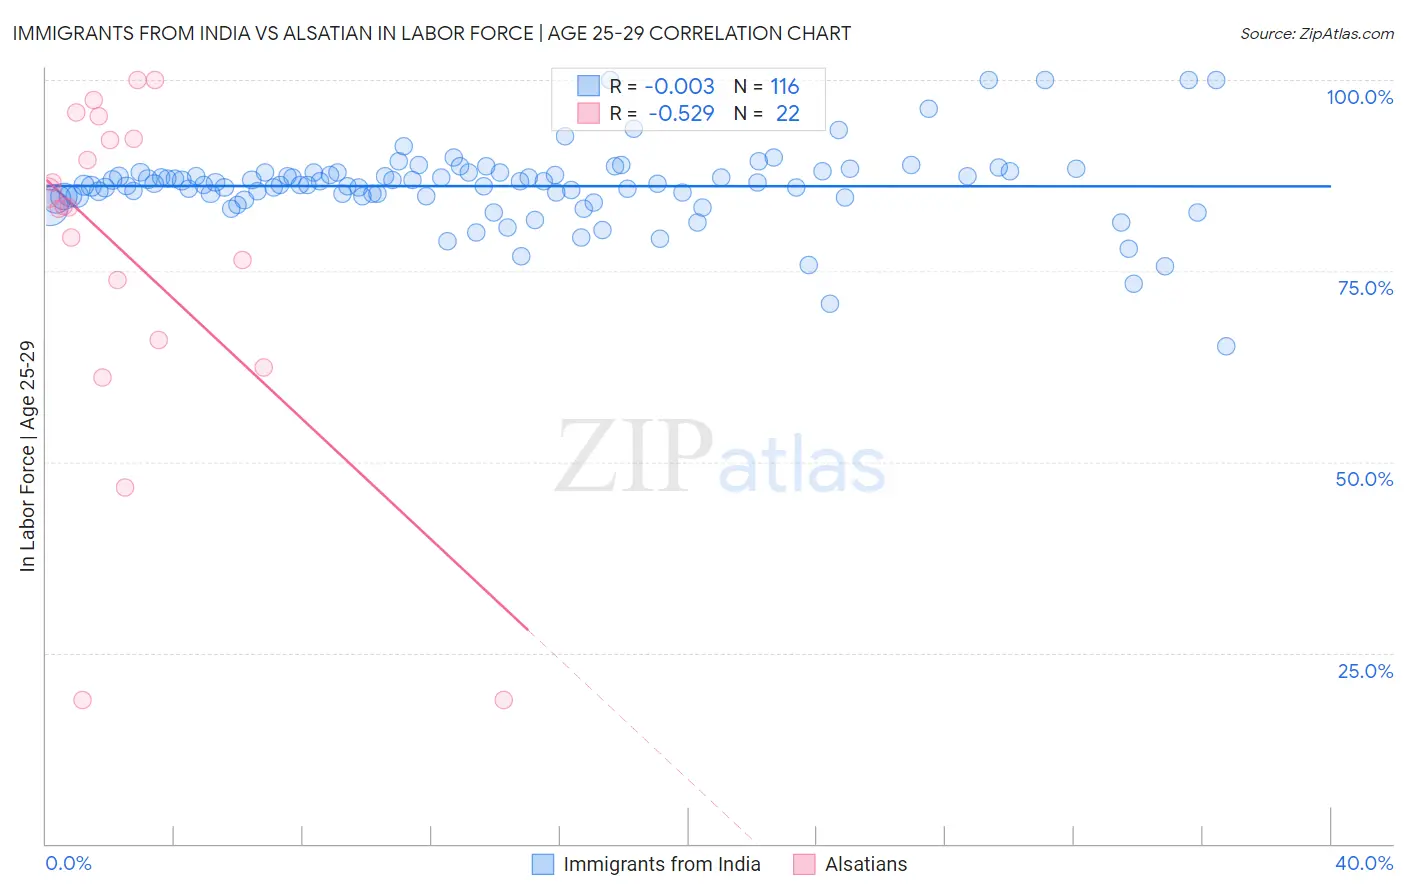
Immigrants from India vs Alsatian In Labor Force | Age 25-29 Correlation Chart
The statistical analysis conducted on geographies consisting of 433,894,506 people shows no correlation between the proportion of Immigrants from India and labor force participation rate among population between the ages 25 and 29 in the United States with a correlation coefficient (R) of -0.003 and weighted average of 85.7%. Similarly, the statistical analysis conducted on geographies consisting of 82,674,236 people shows a substantial negative correlation between the proportion of Alsatians and labor force participation rate among population between the ages 25 and 29 in the United States with a correlation coefficient (R) of -0.529 and weighted average of 83.9%, a difference of 2.2%.
In Labor Force | Age 25-29 Correlation Summary
| Measurement | Immigrants from India | Alsatian |
| Minimum | 65.2% | 18.8% |
| Maximum | 100.0% | 100.0% |
| Range | 34.8% | 81.2% |
| Mean | 86.1% | 76.7% |
| Median | 86.3% | 83.4% |
| Interquartile 25% (IQ1) | 84.8% | 66.0% |
| Interquartile 75% (IQ3) | 87.8% | 92.3% |
| Interquartile Range (IQR) | 3.0% | 26.3% |
| Standard Deviation (Sample) | 5.1% | 23.2% |
| Standard Deviation (Population) | 5.1% | 22.7% |
Similar Demographics by In Labor Force | Age 25-29
Demographics Similar to Immigrants from India by In Labor Force | Age 25-29
In terms of in labor force | age 25-29, the demographic groups most similar to Immigrants from India are Immigrants from Eritrea (85.7%, a difference of 0.010%), Macedonian (85.7%, a difference of 0.010%), Immigrants from Sierra Leone (85.7%, a difference of 0.010%), Czech (85.6%, a difference of 0.040%), and Immigrants from Greece (85.7%, a difference of 0.050%).
| Demographics | Rating | Rank | In Labor Force | Age 25-29 |
| Immigrants | Nepal | 99.9 /100 | #36 | Exceptional 85.8% |
| Poles | 99.9 /100 | #37 | Exceptional 85.8% |
| Sierra Leoneans | 99.9 /100 | #38 | Exceptional 85.8% |
| Croatians | 99.9 /100 | #39 | Exceptional 85.8% |
| Immigrants | Albania | 99.9 /100 | #40 | Exceptional 85.7% |
| Immigrants | Greece | 99.9 /100 | #41 | Exceptional 85.7% |
| Immigrants | Eritrea | 99.9 /100 | #42 | Exceptional 85.7% |
| Immigrants | India | 99.9 /100 | #43 | Exceptional 85.7% |
| Macedonians | 99.9 /100 | #44 | Exceptional 85.7% |
| Immigrants | Sierra Leone | 99.9 /100 | #45 | Exceptional 85.7% |
| Czechs | 99.8 /100 | #46 | Exceptional 85.6% |
| Turks | 99.8 /100 | #47 | Exceptional 85.6% |
| Italians | 99.8 /100 | #48 | Exceptional 85.6% |
| Swedes | 99.8 /100 | #49 | Exceptional 85.6% |
| Yugoslavians | 99.8 /100 | #50 | Exceptional 85.6% |
Demographics Similar to Alsatians by In Labor Force | Age 25-29
In terms of in labor force | age 25-29, the demographic groups most similar to Alsatians are Trinidadian and Tobagonian (83.9%, a difference of 0.020%), Immigrants from Uzbekistan (83.9%, a difference of 0.030%), Jamaican (83.9%, a difference of 0.030%), U.S. Virgin Islander (83.8%, a difference of 0.030%), and Salvadoran (83.8%, a difference of 0.040%).
| Demographics | Rating | Rank | In Labor Force | Age 25-29 |
| Barbadians | 1.0 /100 | #234 | Tragic 83.9% |
| Iraqis | 0.9 /100 | #235 | Tragic 83.9% |
| Guamanians/Chamorros | 0.9 /100 | #236 | Tragic 83.9% |
| Immigrants | Immigrants | 0.9 /100 | #237 | Tragic 83.9% |
| Immigrants | Uzbekistan | 0.8 /100 | #238 | Tragic 83.9% |
| Jamaicans | 0.8 /100 | #239 | Tragic 83.9% |
| Trinidadians and Tobagonians | 0.7 /100 | #240 | Tragic 83.9% |
| Alsatians | 0.7 /100 | #241 | Tragic 83.9% |
| U.S. Virgin Islanders | 0.6 /100 | #242 | Tragic 83.8% |
| Salvadorans | 0.5 /100 | #243 | Tragic 83.8% |
| Immigrants | Jamaica | 0.4 /100 | #244 | Tragic 83.8% |
| Iroquois | 0.4 /100 | #245 | Tragic 83.8% |
| Cree | 0.3 /100 | #246 | Tragic 83.8% |
| Immigrants | El Salvador | 0.3 /100 | #247 | Tragic 83.7% |
| Immigrants | Nonimmigrants | 0.3 /100 | #248 | Tragic 83.7% |