Croatian vs Inupiat In Labor Force | Age 25-29
COMPARE
Croatian
Inupiat
In Labor Force | Age 25-29
In Labor Force | Age 25-29 Comparison
Croatians
Inupiat
85.8%
IN LABOR FORCE | AGE 25-29
99.9/ 100
METRIC RATING
39th/ 347
METRIC RANK
79.8%
IN LABOR FORCE | AGE 25-29
0.0/ 100
METRIC RATING
332nd/ 347
METRIC RANK
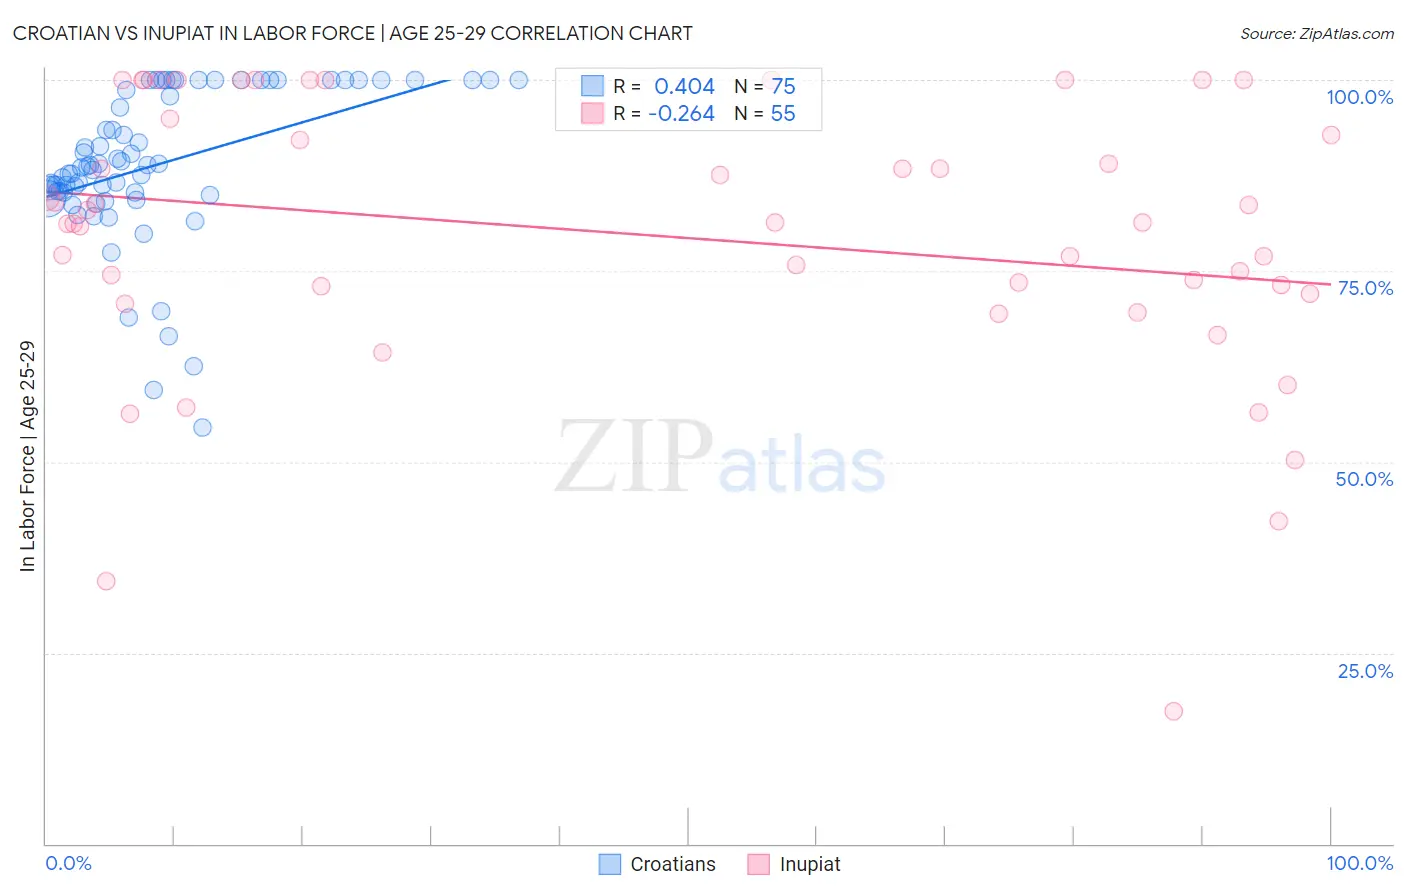
Croatian vs Inupiat In Labor Force | Age 25-29 Correlation Chart
The statistical analysis conducted on geographies consisting of 375,575,461 people shows a moderate positive correlation between the proportion of Croatians and labor force participation rate among population between the ages 25 and 29 in the United States with a correlation coefficient (R) of 0.404 and weighted average of 85.8%. Similarly, the statistical analysis conducted on geographies consisting of 96,328,629 people shows a weak negative correlation between the proportion of Inupiat and labor force participation rate among population between the ages 25 and 29 in the United States with a correlation coefficient (R) of -0.264 and weighted average of 79.8%, a difference of 7.5%.
In Labor Force | Age 25-29 Correlation Summary
| Measurement | Croatian | Inupiat |
| Minimum | 54.5% | 17.4% |
| Maximum | 100.0% | 100.0% |
| Range | 45.5% | 82.6% |
| Mean | 88.9% | 79.7% |
| Median | 88.8% | 81.3% |
| Interquartile 25% (IQ1) | 85.2% | 72.0% |
| Interquartile 75% (IQ3) | 100.0% | 94.9% |
| Interquartile Range (IQR) | 14.8% | 22.9% |
| Standard Deviation (Sample) | 10.0% | 18.0% |
| Standard Deviation (Population) | 10.0% | 17.9% |
Similar Demographics by In Labor Force | Age 25-29
Demographics Similar to Croatians by In Labor Force | Age 25-29
In terms of in labor force | age 25-29, the demographic groups most similar to Croatians are Sierra Leonean (85.8%, a difference of 0.0%), Immigrants from Albania (85.7%, a difference of 0.020%), Polish (85.8%, a difference of 0.030%), Immigrants from Greece (85.7%, a difference of 0.030%), and Immigrants from Nepal (85.8%, a difference of 0.050%).
| Demographics | Rating | Rank | In Labor Force | Age 25-29 |
| Slovaks | 100.0 /100 | #32 | Exceptional 85.8% |
| Immigrants | Bulgaria | 100.0 /100 | #33 | Exceptional 85.8% |
| Lithuanians | 99.9 /100 | #34 | Exceptional 85.8% |
| Cypriots | 99.9 /100 | #35 | Exceptional 85.8% |
| Immigrants | Nepal | 99.9 /100 | #36 | Exceptional 85.8% |
| Poles | 99.9 /100 | #37 | Exceptional 85.8% |
| Sierra Leoneans | 99.9 /100 | #38 | Exceptional 85.8% |
| Croatians | 99.9 /100 | #39 | Exceptional 85.8% |
| Immigrants | Albania | 99.9 /100 | #40 | Exceptional 85.7% |
| Immigrants | Greece | 99.9 /100 | #41 | Exceptional 85.7% |
| Immigrants | Eritrea | 99.9 /100 | #42 | Exceptional 85.7% |
| Immigrants | India | 99.9 /100 | #43 | Exceptional 85.7% |
| Macedonians | 99.9 /100 | #44 | Exceptional 85.7% |
| Immigrants | Sierra Leone | 99.9 /100 | #45 | Exceptional 85.7% |
| Czechs | 99.8 /100 | #46 | Exceptional 85.6% |
Demographics Similar to Inupiat by In Labor Force | Age 25-29
In terms of in labor force | age 25-29, the demographic groups most similar to Inupiat are Sioux (79.7%, a difference of 0.11%), Yuman (79.3%, a difference of 0.53%), Native/Alaskan (79.3%, a difference of 0.61%), Apache (79.2%, a difference of 0.68%), and Cheyenne (80.3%, a difference of 0.69%).
| Demographics | Rating | Rank | In Labor Force | Age 25-29 |
| Dutch West Indians | 0.0 /100 | #325 | Tragic 81.1% |
| Choctaw | 0.0 /100 | #326 | Tragic 81.0% |
| Ute | 0.0 /100 | #327 | Tragic 80.8% |
| Creek | 0.0 /100 | #328 | Tragic 80.7% |
| Yakama | 0.0 /100 | #329 | Tragic 80.6% |
| Puerto Ricans | 0.0 /100 | #330 | Tragic 80.4% |
| Cheyenne | 0.0 /100 | #331 | Tragic 80.3% |
| Inupiat | 0.0 /100 | #332 | Tragic 79.8% |
| Sioux | 0.0 /100 | #333 | Tragic 79.7% |
| Yuman | 0.0 /100 | #334 | Tragic 79.3% |
| Natives/Alaskans | 0.0 /100 | #335 | Tragic 79.3% |
| Apache | 0.0 /100 | #336 | Tragic 79.2% |
| Crow | 0.0 /100 | #337 | Tragic 78.6% |
| Lumbee | 0.0 /100 | #338 | Tragic 78.3% |
| Immigrants | Yemen | 0.0 /100 | #339 | Tragic 78.2% |