Immigrants from India vs Inupiat 10th Grade
COMPARE
Immigrants from India
Inupiat
10th Grade
10th Grade Comparison
Immigrants from India
Inupiat
95.3%
10TH GRADE
99.9/ 100
METRIC RATING
36th/ 347
METRIC RANK
94.4%
10TH GRADE
95.1/ 100
METRIC RATING
122nd/ 347
METRIC RANK
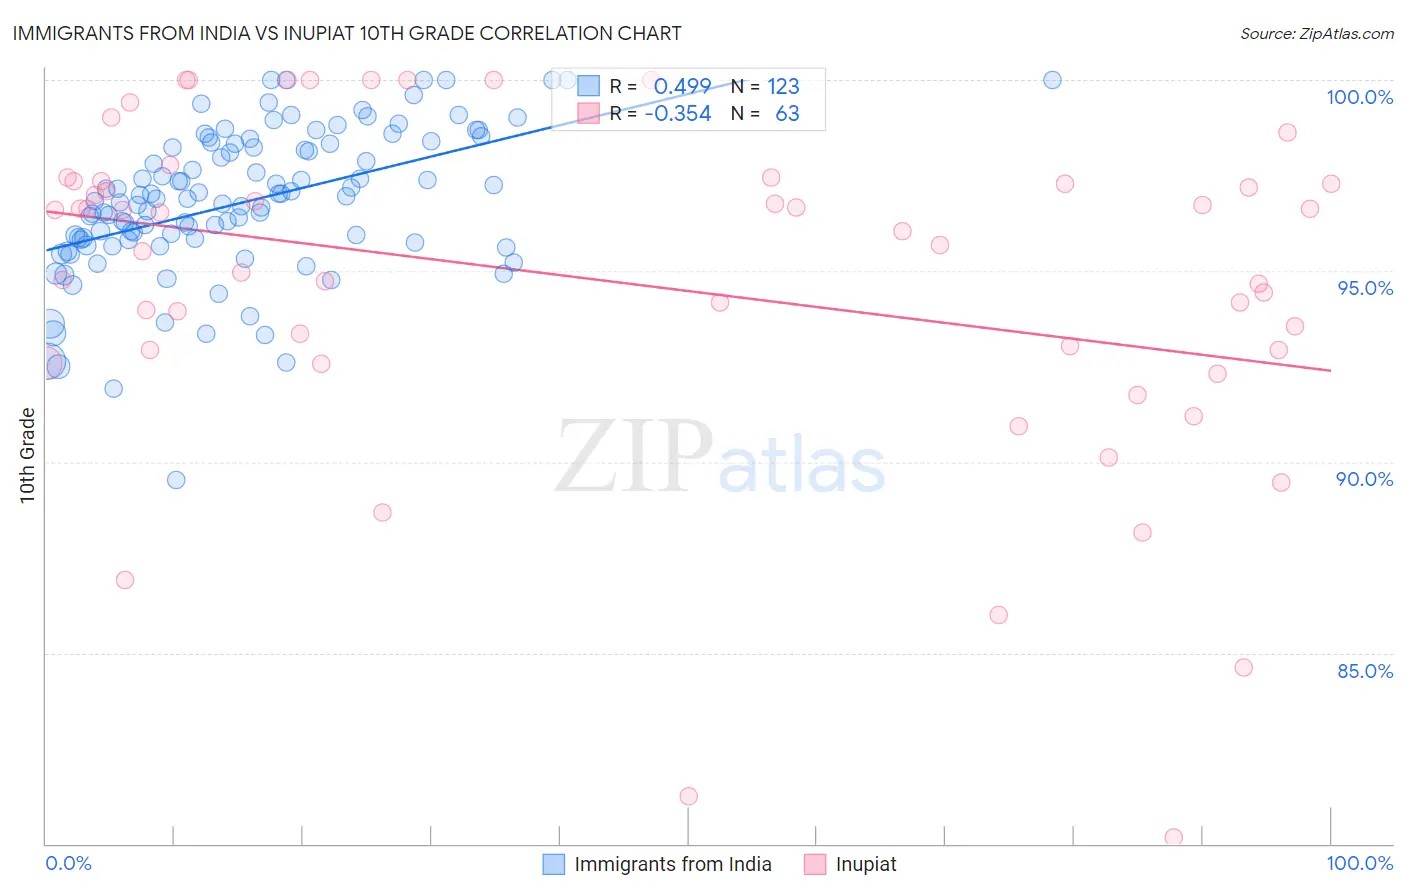
Immigrants from India vs Inupiat 10th Grade Correlation Chart
The statistical analysis conducted on geographies consisting of 434,105,844 people shows a moderate positive correlation between the proportion of Immigrants from India and percentage of population with at least 10th grade education in the United States with a correlation coefficient (R) of 0.499 and weighted average of 95.3%. Similarly, the statistical analysis conducted on geographies consisting of 96,349,240 people shows a mild negative correlation between the proportion of Inupiat and percentage of population with at least 10th grade education in the United States with a correlation coefficient (R) of -0.354 and weighted average of 94.4%, a difference of 1.0%.
10th Grade Correlation Summary
| Measurement | Immigrants from India | Inupiat |
| Minimum | 89.5% | 80.2% |
| Maximum | 100.0% | 100.0% |
| Range | 10.5% | 19.8% |
| Mean | 96.8% | 94.7% |
| Median | 96.9% | 96.0% |
| Interquartile 25% (IQ1) | 95.8% | 92.9% |
| Interquartile 75% (IQ3) | 98.3% | 97.3% |
| Interquartile Range (IQR) | 2.5% | 4.4% |
| Standard Deviation (Sample) | 1.9% | 4.4% |
| Standard Deviation (Population) | 1.9% | 4.4% |
Similar Demographics by 10th Grade
Demographics Similar to Immigrants from India by 10th Grade
In terms of 10th grade, the demographic groups most similar to Immigrants from India are Estonian (95.3%, a difference of 0.010%), Hungarian (95.3%, a difference of 0.020%), French (95.3%, a difference of 0.020%), British (95.3%, a difference of 0.020%), and French Canadian (95.3%, a difference of 0.020%).
| Demographics | Rating | Rank | 10th Grade |
| Bulgarians | 100.0 /100 | #29 | Exceptional 95.4% |
| Belgians | 100.0 /100 | #30 | Exceptional 95.4% |
| Iranians | 100.0 /100 | #31 | Exceptional 95.3% |
| Hungarians | 100.0 /100 | #32 | Exceptional 95.3% |
| French | 100.0 /100 | #33 | Exceptional 95.3% |
| British | 99.9 /100 | #34 | Exceptional 95.3% |
| Estonians | 99.9 /100 | #35 | Exceptional 95.3% |
| Immigrants | India | 99.9 /100 | #36 | Exceptional 95.3% |
| French Canadians | 99.9 /100 | #37 | Exceptional 95.3% |
| Northern Europeans | 99.9 /100 | #38 | Exceptional 95.3% |
| Immigrants | Scotland | 99.9 /100 | #39 | Exceptional 95.2% |
| Scotch-Irish | 99.9 /100 | #40 | Exceptional 95.2% |
| Russians | 99.9 /100 | #41 | Exceptional 95.2% |
| Slavs | 99.9 /100 | #42 | Exceptional 95.2% |
| Macedonians | 99.9 /100 | #43 | Exceptional 95.2% |
Demographics Similar to Inupiat by 10th Grade
In terms of 10th grade, the demographic groups most similar to Inupiat are Immigrants from Belarus (94.4%, a difference of 0.0%), Cree (94.4%, a difference of 0.0%), Immigrants from Israel (94.4%, a difference of 0.010%), Immigrants from Taiwan (94.4%, a difference of 0.010%), and Basque (94.3%, a difference of 0.010%).
| Demographics | Rating | Rank | 10th Grade |
| Delaware | 96.3 /100 | #115 | Exceptional 94.4% |
| Sioux | 96.2 /100 | #116 | Exceptional 94.4% |
| Immigrants | Hungary | 95.8 /100 | #117 | Exceptional 94.4% |
| Jordanians | 95.6 /100 | #118 | Exceptional 94.4% |
| Immigrants | Israel | 95.4 /100 | #119 | Exceptional 94.4% |
| Immigrants | Taiwan | 95.3 /100 | #120 | Exceptional 94.4% |
| Immigrants | Belarus | 95.2 /100 | #121 | Exceptional 94.4% |
| Inupiat | 95.1 /100 | #122 | Exceptional 94.4% |
| Cree | 95.1 /100 | #123 | Exceptional 94.4% |
| Basques | 94.9 /100 | #124 | Exceptional 94.3% |
| Americans | 94.4 /100 | #125 | Exceptional 94.3% |
| Immigrants | Iran | 94.4 /100 | #126 | Exceptional 94.3% |
| Israelis | 93.8 /100 | #127 | Exceptional 94.3% |
| Potawatomi | 93.6 /100 | #128 | Exceptional 94.3% |
| Iroquois | 92.8 /100 | #129 | Exceptional 94.3% |