Immigrants from Moldova vs Inupiat In Labor Force | Age 25-29
COMPARE
Immigrants from Moldova
Inupiat
In Labor Force | Age 25-29
In Labor Force | Age 25-29 Comparison
Immigrants from Moldova
Inupiat
85.1%
IN LABOR FORCE | AGE 25-29
95.8/ 100
METRIC RATING
91st/ 347
METRIC RANK
79.8%
IN LABOR FORCE | AGE 25-29
0.0/ 100
METRIC RATING
332nd/ 347
METRIC RANK
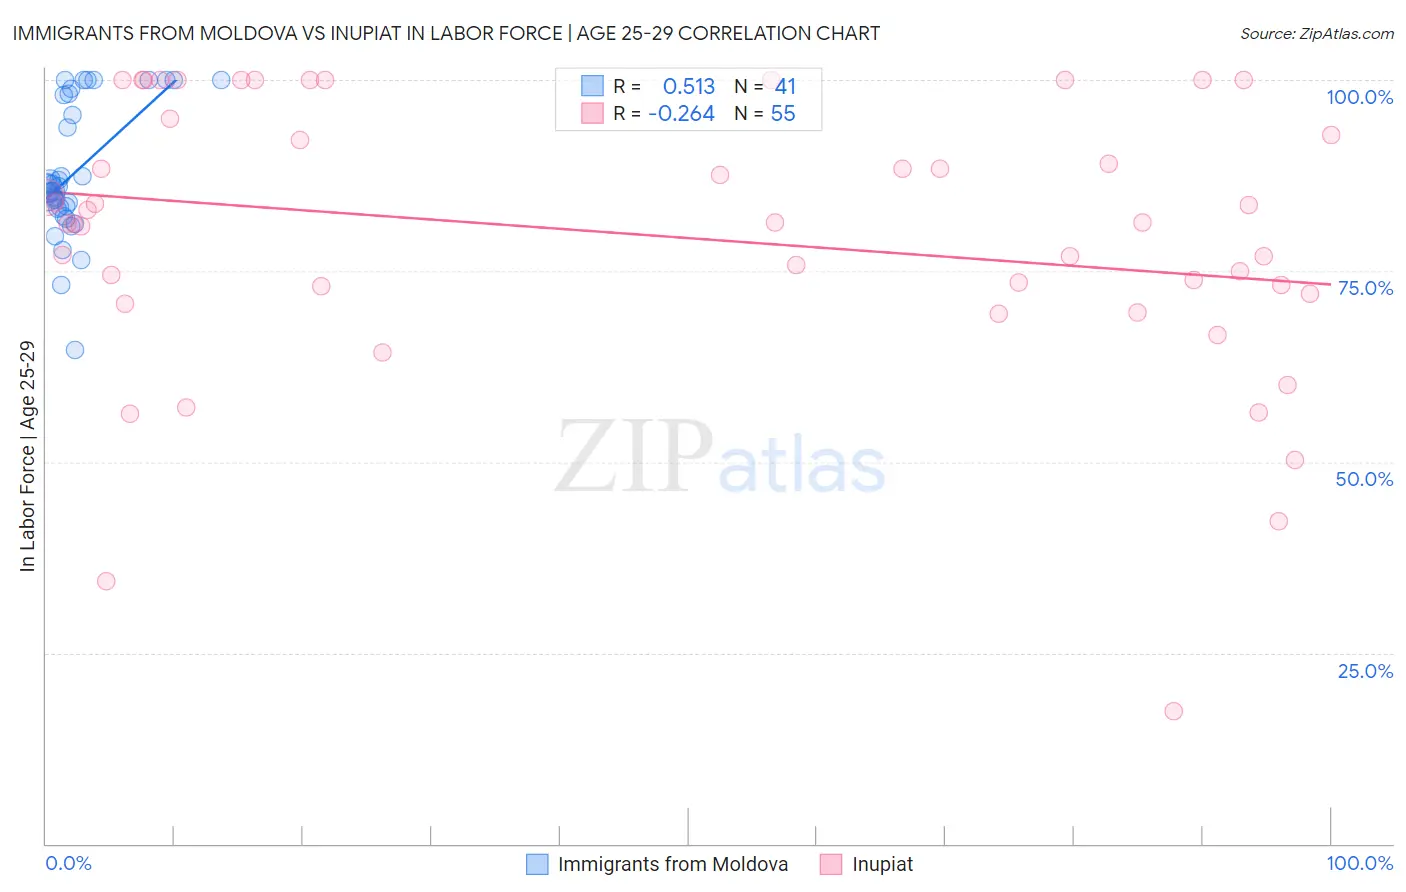
Immigrants from Moldova vs Inupiat In Labor Force | Age 25-29 Correlation Chart
The statistical analysis conducted on geographies consisting of 124,394,056 people shows a substantial positive correlation between the proportion of Immigrants from Moldova and labor force participation rate among population between the ages 25 and 29 in the United States with a correlation coefficient (R) of 0.513 and weighted average of 85.1%. Similarly, the statistical analysis conducted on geographies consisting of 96,328,629 people shows a weak negative correlation between the proportion of Inupiat and labor force participation rate among population between the ages 25 and 29 in the United States with a correlation coefficient (R) of -0.264 and weighted average of 79.8%, a difference of 6.8%.
In Labor Force | Age 25-29 Correlation Summary
| Measurement | Immigrants from Moldova | Inupiat |
| Minimum | 64.6% | 17.4% |
| Maximum | 100.0% | 100.0% |
| Range | 35.4% | 82.6% |
| Mean | 87.9% | 79.7% |
| Median | 85.5% | 81.3% |
| Interquartile 25% (IQ1) | 83.2% | 72.0% |
| Interquartile 75% (IQ3) | 98.1% | 94.9% |
| Interquartile Range (IQR) | 14.9% | 22.9% |
| Standard Deviation (Sample) | 8.6% | 18.0% |
| Standard Deviation (Population) | 8.5% | 17.9% |
Similar Demographics by In Labor Force | Age 25-29
Demographics Similar to Immigrants from Moldova by In Labor Force | Age 25-29
In terms of in labor force | age 25-29, the demographic groups most similar to Immigrants from Moldova are Burmese (85.1%, a difference of 0.010%), Immigrants from Costa Rica (85.1%, a difference of 0.010%), Austrian (85.1%, a difference of 0.020%), Immigrants from Croatia (85.2%, a difference of 0.030%), and Immigrants from France (85.2%, a difference of 0.030%).
| Demographics | Rating | Rank | In Labor Force | Age 25-29 |
| Immigrants | Eastern Europe | 96.8 /100 | #84 | Exceptional 85.2% |
| Immigrants | Africa | 96.7 /100 | #85 | Exceptional 85.2% |
| Ukrainians | 96.7 /100 | #86 | Exceptional 85.2% |
| French Canadians | 96.5 /100 | #87 | Exceptional 85.2% |
| Immigrants | Croatia | 96.4 /100 | #88 | Exceptional 85.2% |
| Immigrants | France | 96.3 /100 | #89 | Exceptional 85.2% |
| Burmese | 95.9 /100 | #90 | Exceptional 85.1% |
| Immigrants | Moldova | 95.8 /100 | #91 | Exceptional 85.1% |
| Immigrants | Costa Rica | 95.5 /100 | #92 | Exceptional 85.1% |
| Austrians | 95.3 /100 | #93 | Exceptional 85.1% |
| Immigrants | Korea | 94.8 /100 | #94 | Exceptional 85.1% |
| Immigrants | Netherlands | 94.6 /100 | #95 | Exceptional 85.1% |
| Immigrants | Romania | 94.6 /100 | #96 | Exceptional 85.1% |
| Immigrants | Sudan | 94.3 /100 | #97 | Exceptional 85.1% |
| Mongolians | 94.1 /100 | #98 | Exceptional 85.1% |
Demographics Similar to Inupiat by In Labor Force | Age 25-29
In terms of in labor force | age 25-29, the demographic groups most similar to Inupiat are Sioux (79.7%, a difference of 0.11%), Yuman (79.3%, a difference of 0.53%), Native/Alaskan (79.3%, a difference of 0.61%), Apache (79.2%, a difference of 0.68%), and Cheyenne (80.3%, a difference of 0.69%).
| Demographics | Rating | Rank | In Labor Force | Age 25-29 |
| Dutch West Indians | 0.0 /100 | #325 | Tragic 81.1% |
| Choctaw | 0.0 /100 | #326 | Tragic 81.0% |
| Ute | 0.0 /100 | #327 | Tragic 80.8% |
| Creek | 0.0 /100 | #328 | Tragic 80.7% |
| Yakama | 0.0 /100 | #329 | Tragic 80.6% |
| Puerto Ricans | 0.0 /100 | #330 | Tragic 80.4% |
| Cheyenne | 0.0 /100 | #331 | Tragic 80.3% |
| Inupiat | 0.0 /100 | #332 | Tragic 79.8% |
| Sioux | 0.0 /100 | #333 | Tragic 79.7% |
| Yuman | 0.0 /100 | #334 | Tragic 79.3% |
| Natives/Alaskans | 0.0 /100 | #335 | Tragic 79.3% |
| Apache | 0.0 /100 | #336 | Tragic 79.2% |
| Crow | 0.0 /100 | #337 | Tragic 78.6% |
| Lumbee | 0.0 /100 | #338 | Tragic 78.3% |
| Immigrants | Yemen | 0.0 /100 | #339 | Tragic 78.2% |