Immigrants from Hungary vs Israeli In Labor Force | Age 20-24
COMPARE
Immigrants from Hungary
Israeli
In Labor Force | Age 20-24
In Labor Force | Age 20-24 Comparison
Immigrants from Hungary
Israelis
74.9%
IN LABOR FORCE | AGE 20-24
35.0/ 100
METRIC RATING
184th/ 347
METRIC RANK
72.6%
IN LABOR FORCE | AGE 20-24
0.0/ 100
METRIC RATING
298th/ 347
METRIC RANK
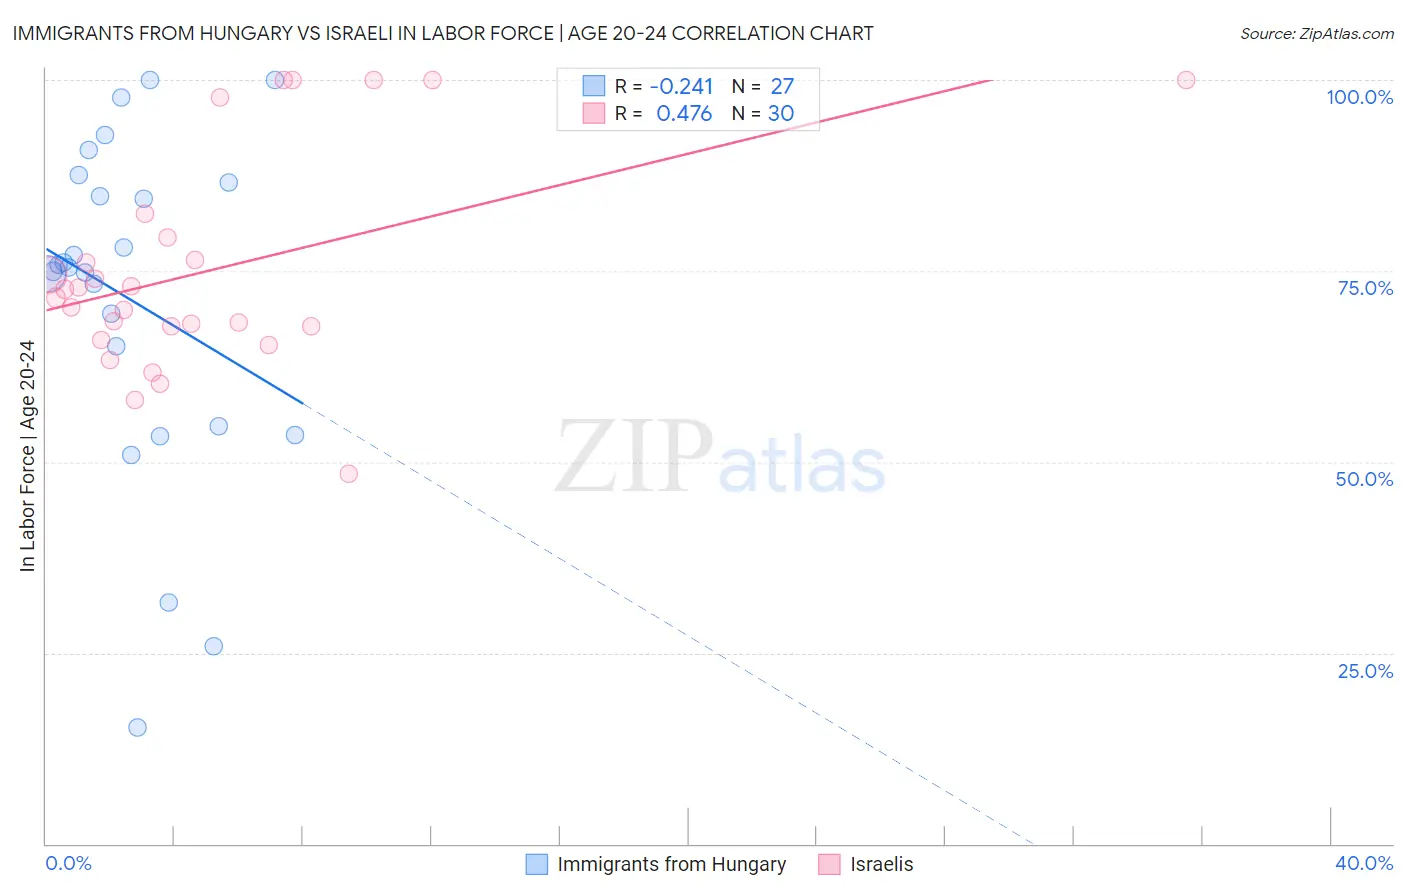
Immigrants from Hungary vs Israeli In Labor Force | Age 20-24 Correlation Chart
The statistical analysis conducted on geographies consisting of 195,632,924 people shows a weak negative correlation between the proportion of Immigrants from Hungary and labor force participation rate among population between the ages 20 and 24 in the United States with a correlation coefficient (R) of -0.241 and weighted average of 74.9%. Similarly, the statistical analysis conducted on geographies consisting of 211,140,370 people shows a moderate positive correlation between the proportion of Israelis and labor force participation rate among population between the ages 20 and 24 in the United States with a correlation coefficient (R) of 0.476 and weighted average of 72.6%, a difference of 3.2%.
In Labor Force | Age 20-24 Correlation Summary
| Measurement | Immigrants from Hungary | Israeli |
| Minimum | 15.2% | 48.4% |
| Maximum | 100.0% | 100.0% |
| Range | 84.8% | 51.6% |
| Mean | 71.3% | 75.1% |
| Median | 75.5% | 72.0% |
| Interquartile 25% (IQ1) | 54.6% | 67.7% |
| Interquartile 75% (IQ3) | 86.5% | 79.4% |
| Interquartile Range (IQR) | 31.9% | 11.7% |
| Standard Deviation (Sample) | 21.8% | 14.1% |
| Standard Deviation (Population) | 21.4% | 13.8% |
Similar Demographics by In Labor Force | Age 20-24
Demographics Similar to Immigrants from Hungary by In Labor Force | Age 20-24
In terms of in labor force | age 20-24, the demographic groups most similar to Immigrants from Hungary are Sri Lankan (74.9%, a difference of 0.0%), Immigrants from Eastern Europe (74.9%, a difference of 0.020%), Immigrants from Honduras (74.9%, a difference of 0.020%), Immigrants from South Africa (74.9%, a difference of 0.030%), and Immigrants from Costa Rica (74.9%, a difference of 0.030%).
| Demographics | Rating | Rank | In Labor Force | Age 20-24 |
| Immigrants | Mexico | 47.8 /100 | #177 | Average 75.0% |
| Immigrants | Central America | 45.0 /100 | #178 | Average 75.0% |
| Immigrants | Latvia | 44.1 /100 | #179 | Average 75.0% |
| Immigrants | Czechoslovakia | 44.0 /100 | #180 | Average 75.0% |
| Africans | 42.5 /100 | #181 | Average 75.0% |
| Immigrants | South Africa | 36.9 /100 | #182 | Fair 74.9% |
| Immigrants | Costa Rica | 36.7 /100 | #183 | Fair 74.9% |
| Immigrants | Hungary | 35.0 /100 | #184 | Fair 74.9% |
| Sri Lankans | 34.9 /100 | #185 | Fair 74.9% |
| Immigrants | Eastern Europe | 33.8 /100 | #186 | Fair 74.9% |
| Immigrants | Honduras | 33.5 /100 | #187 | Fair 74.9% |
| Hondurans | 32.7 /100 | #188 | Fair 74.8% |
| Immigrants | Northern Europe | 32.6 /100 | #189 | Fair 74.8% |
| Russians | 32.2 /100 | #190 | Fair 74.8% |
| Senegalese | 28.1 /100 | #191 | Fair 74.8% |
Demographics Similar to Israelis by In Labor Force | Age 20-24
In terms of in labor force | age 20-24, the demographic groups most similar to Israelis are Iranian (72.6%, a difference of 0.040%), Armenian (72.5%, a difference of 0.070%), Central American Indian (72.7%, a difference of 0.13%), Cuban (72.5%, a difference of 0.14%), and Jamaican (72.7%, a difference of 0.17%).
| Demographics | Rating | Rank | In Labor Force | Age 20-24 |
| Immigrants | Nicaragua | 0.0 /100 | #291 | Tragic 72.9% |
| Pueblo | 0.0 /100 | #292 | Tragic 72.9% |
| Immigrants | Belize | 0.0 /100 | #293 | Tragic 72.8% |
| Immigrants | Argentina | 0.0 /100 | #294 | Tragic 72.8% |
| Okinawans | 0.0 /100 | #295 | Tragic 72.7% |
| Jamaicans | 0.0 /100 | #296 | Tragic 72.7% |
| Central American Indians | 0.0 /100 | #297 | Tragic 72.7% |
| Israelis | 0.0 /100 | #298 | Tragic 72.6% |
| Iranians | 0.0 /100 | #299 | Tragic 72.6% |
| Armenians | 0.0 /100 | #300 | Tragic 72.5% |
| Cubans | 0.0 /100 | #301 | Tragic 72.5% |
| Natives/Alaskans | 0.0 /100 | #302 | Tragic 72.4% |
| Ecuadorians | 0.0 /100 | #303 | Tragic 72.4% |
| Immigrants | West Indies | 0.0 /100 | #304 | Tragic 72.4% |
| Immigrants | Singapore | 0.0 /100 | #305 | Tragic 72.4% |