Immigrants from Hungary vs Scotch-Irish In Labor Force | Age 20-24
COMPARE
Immigrants from Hungary
Scotch-Irish
In Labor Force | Age 20-24
In Labor Force | Age 20-24 Comparison
Immigrants from Hungary
Scotch-Irish
74.9%
IN LABOR FORCE | AGE 20-24
35.0/ 100
METRIC RATING
184th/ 347
METRIC RANK
77.0%
IN LABOR FORCE | AGE 20-24
99.9/ 100
METRIC RATING
59th/ 347
METRIC RANK
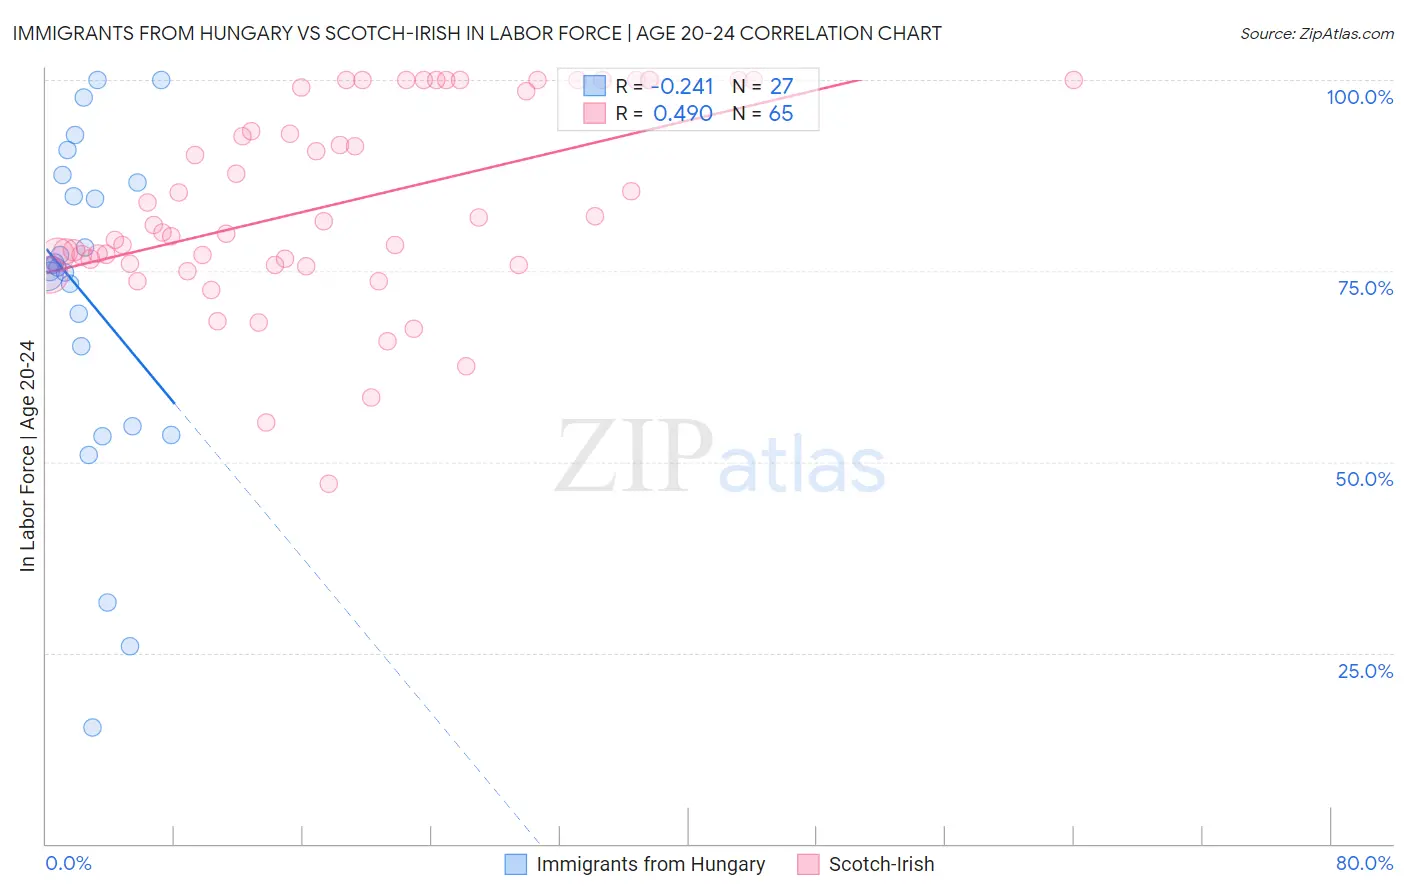
Immigrants from Hungary vs Scotch-Irish In Labor Force | Age 20-24 Correlation Chart
The statistical analysis conducted on geographies consisting of 195,632,924 people shows a weak negative correlation between the proportion of Immigrants from Hungary and labor force participation rate among population between the ages 20 and 24 in the United States with a correlation coefficient (R) of -0.241 and weighted average of 74.9%. Similarly, the statistical analysis conducted on geographies consisting of 547,632,235 people shows a moderate positive correlation between the proportion of Scotch-Irish and labor force participation rate among population between the ages 20 and 24 in the United States with a correlation coefficient (R) of 0.490 and weighted average of 77.0%, a difference of 2.9%.
In Labor Force | Age 20-24 Correlation Summary
| Measurement | Immigrants from Hungary | Scotch-Irish |
| Minimum | 15.2% | 47.2% |
| Maximum | 100.0% | 100.0% |
| Range | 84.8% | 52.8% |
| Mean | 71.3% | 83.8% |
| Median | 75.5% | 81.0% |
| Interquartile 25% (IQ1) | 54.6% | 75.9% |
| Interquartile 75% (IQ3) | 86.5% | 99.5% |
| Interquartile Range (IQR) | 31.9% | 23.6% |
| Standard Deviation (Sample) | 21.8% | 13.0% |
| Standard Deviation (Population) | 21.4% | 12.9% |
Similar Demographics by In Labor Force | Age 20-24
Demographics Similar to Immigrants from Hungary by In Labor Force | Age 20-24
In terms of in labor force | age 20-24, the demographic groups most similar to Immigrants from Hungary are Sri Lankan (74.9%, a difference of 0.0%), Immigrants from Eastern Europe (74.9%, a difference of 0.020%), Immigrants from Honduras (74.9%, a difference of 0.020%), Immigrants from South Africa (74.9%, a difference of 0.030%), and Immigrants from Costa Rica (74.9%, a difference of 0.030%).
| Demographics | Rating | Rank | In Labor Force | Age 20-24 |
| Immigrants | Mexico | 47.8 /100 | #177 | Average 75.0% |
| Immigrants | Central America | 45.0 /100 | #178 | Average 75.0% |
| Immigrants | Latvia | 44.1 /100 | #179 | Average 75.0% |
| Immigrants | Czechoslovakia | 44.0 /100 | #180 | Average 75.0% |
| Africans | 42.5 /100 | #181 | Average 75.0% |
| Immigrants | South Africa | 36.9 /100 | #182 | Fair 74.9% |
| Immigrants | Costa Rica | 36.7 /100 | #183 | Fair 74.9% |
| Immigrants | Hungary | 35.0 /100 | #184 | Fair 74.9% |
| Sri Lankans | 34.9 /100 | #185 | Fair 74.9% |
| Immigrants | Eastern Europe | 33.8 /100 | #186 | Fair 74.9% |
| Immigrants | Honduras | 33.5 /100 | #187 | Fair 74.9% |
| Hondurans | 32.7 /100 | #188 | Fair 74.8% |
| Immigrants | Northern Europe | 32.6 /100 | #189 | Fair 74.8% |
| Russians | 32.2 /100 | #190 | Fair 74.8% |
| Senegalese | 28.1 /100 | #191 | Fair 74.8% |
Demographics Similar to Scotch-Irish by In Labor Force | Age 20-24
In terms of in labor force | age 20-24, the demographic groups most similar to Scotch-Irish are Hawaiian (77.0%, a difference of 0.030%), Kenyan (77.0%, a difference of 0.040%), Chippewa (77.1%, a difference of 0.050%), European (77.1%, a difference of 0.060%), and Immigrants from Liberia (77.1%, a difference of 0.070%).
| Demographics | Rating | Rank | In Labor Force | Age 20-24 |
| Indonesians | 100.0 /100 | #52 | Exceptional 77.2% |
| Immigrants | Azores | 100.0 /100 | #53 | Exceptional 77.2% |
| Celtics | 99.9 /100 | #54 | Exceptional 77.1% |
| Immigrants | Liberia | 99.9 /100 | #55 | Exceptional 77.1% |
| Europeans | 99.9 /100 | #56 | Exceptional 77.1% |
| Chippewa | 99.9 /100 | #57 | Exceptional 77.1% |
| Hawaiians | 99.9 /100 | #58 | Exceptional 77.0% |
| Scotch-Irish | 99.9 /100 | #59 | Exceptional 77.0% |
| Kenyans | 99.9 /100 | #60 | Exceptional 77.0% |
| Immigrants | Eritrea | 99.9 /100 | #61 | Exceptional 77.0% |
| Immigrants | Kenya | 99.9 /100 | #62 | Exceptional 77.0% |
| Lithuanians | 99.9 /100 | #63 | Exceptional 77.0% |
| Whites/Caucasians | 99.9 /100 | #64 | Exceptional 76.9% |
| Crow | 99.9 /100 | #65 | Exceptional 76.9% |
| Icelanders | 99.9 /100 | #66 | Exceptional 76.9% |