Immigrants from Hungary vs Turkish In Labor Force | Age 20-24
COMPARE
Immigrants from Hungary
Turkish
In Labor Force | Age 20-24
In Labor Force | Age 20-24 Comparison
Immigrants from Hungary
Turks
74.9%
IN LABOR FORCE | AGE 20-24
35.0/ 100
METRIC RATING
184th/ 347
METRIC RANK
73.9%
IN LABOR FORCE | AGE 20-24
1.8/ 100
METRIC RATING
245th/ 347
METRIC RANK
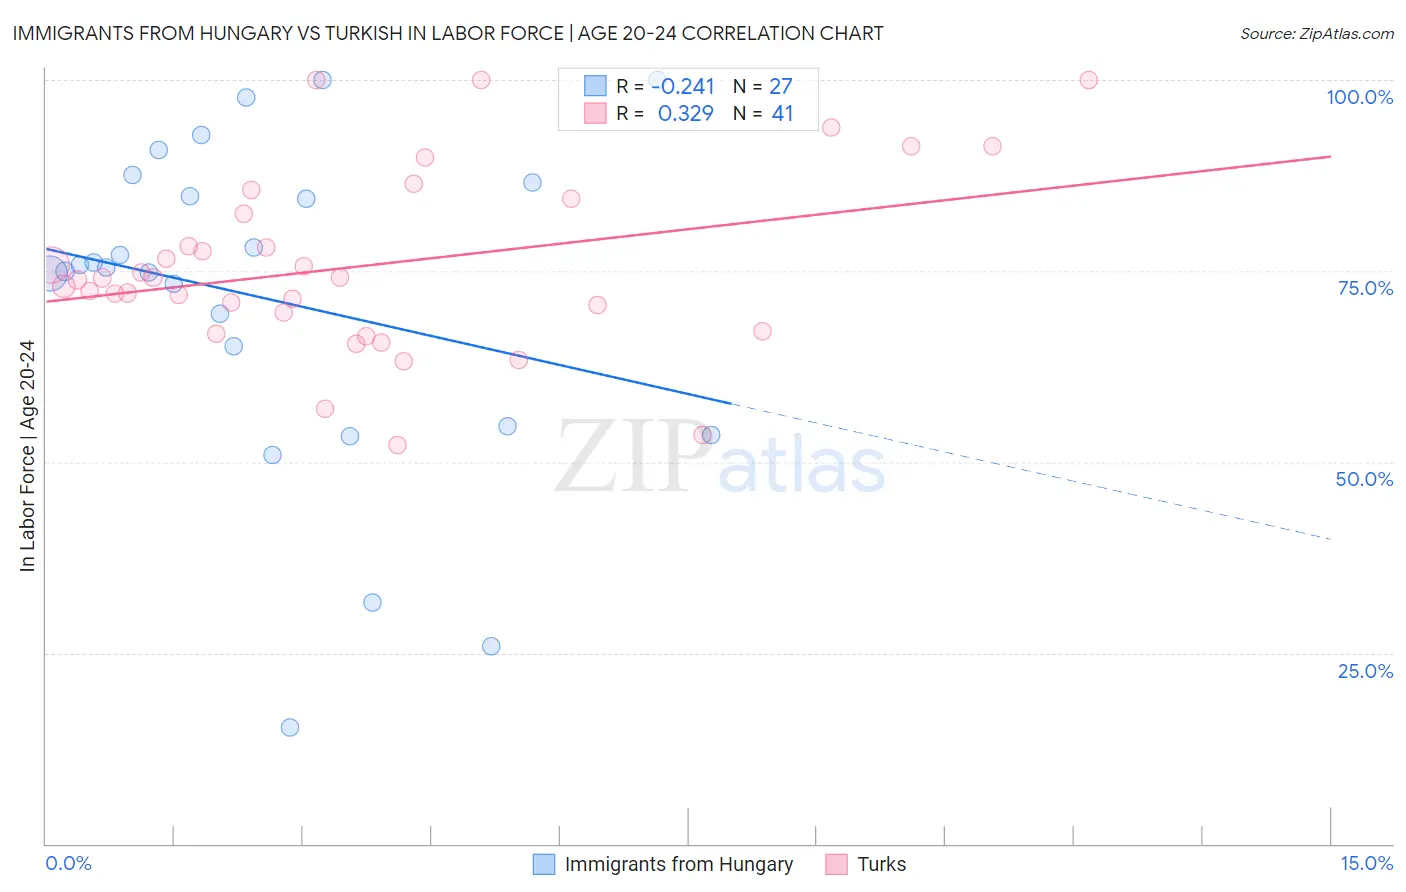
Immigrants from Hungary vs Turkish In Labor Force | Age 20-24 Correlation Chart
The statistical analysis conducted on geographies consisting of 195,632,924 people shows a weak negative correlation between the proportion of Immigrants from Hungary and labor force participation rate among population between the ages 20 and 24 in the United States with a correlation coefficient (R) of -0.241 and weighted average of 74.9%. Similarly, the statistical analysis conducted on geographies consisting of 271,784,032 people shows a mild positive correlation between the proportion of Turks and labor force participation rate among population between the ages 20 and 24 in the United States with a correlation coefficient (R) of 0.329 and weighted average of 73.9%, a difference of 1.3%.
In Labor Force | Age 20-24 Correlation Summary
| Measurement | Immigrants from Hungary | Turkish |
| Minimum | 15.2% | 52.3% |
| Maximum | 100.0% | 100.0% |
| Range | 84.8% | 47.7% |
| Mean | 71.3% | 75.7% |
| Median | 75.5% | 74.1% |
| Interquartile 25% (IQ1) | 54.6% | 68.3% |
| Interquartile 75% (IQ3) | 86.5% | 83.5% |
| Interquartile Range (IQR) | 31.9% | 15.2% |
| Standard Deviation (Sample) | 21.8% | 11.7% |
| Standard Deviation (Population) | 21.4% | 11.5% |
Similar Demographics by In Labor Force | Age 20-24
Demographics Similar to Immigrants from Hungary by In Labor Force | Age 20-24
In terms of in labor force | age 20-24, the demographic groups most similar to Immigrants from Hungary are Sri Lankan (74.9%, a difference of 0.0%), Immigrants from Eastern Europe (74.9%, a difference of 0.020%), Immigrants from Honduras (74.9%, a difference of 0.020%), Immigrants from South Africa (74.9%, a difference of 0.030%), and Immigrants from Costa Rica (74.9%, a difference of 0.030%).
| Demographics | Rating | Rank | In Labor Force | Age 20-24 |
| Immigrants | Mexico | 47.8 /100 | #177 | Average 75.0% |
| Immigrants | Central America | 45.0 /100 | #178 | Average 75.0% |
| Immigrants | Latvia | 44.1 /100 | #179 | Average 75.0% |
| Immigrants | Czechoslovakia | 44.0 /100 | #180 | Average 75.0% |
| Africans | 42.5 /100 | #181 | Average 75.0% |
| Immigrants | South Africa | 36.9 /100 | #182 | Fair 74.9% |
| Immigrants | Costa Rica | 36.7 /100 | #183 | Fair 74.9% |
| Immigrants | Hungary | 35.0 /100 | #184 | Fair 74.9% |
| Sri Lankans | 34.9 /100 | #185 | Fair 74.9% |
| Immigrants | Eastern Europe | 33.8 /100 | #186 | Fair 74.9% |
| Immigrants | Honduras | 33.5 /100 | #187 | Fair 74.9% |
| Hondurans | 32.7 /100 | #188 | Fair 74.8% |
| Immigrants | Northern Europe | 32.6 /100 | #189 | Fair 74.8% |
| Russians | 32.2 /100 | #190 | Fair 74.8% |
| Senegalese | 28.1 /100 | #191 | Fair 74.8% |
Demographics Similar to Turks by In Labor Force | Age 20-24
In terms of in labor force | age 20-24, the demographic groups most similar to Turks are Immigrants from Syria (74.0%, a difference of 0.030%), Immigrants from South Central Asia (74.0%, a difference of 0.030%), Immigrants from Panama (73.9%, a difference of 0.040%), Thai (74.0%, a difference of 0.060%), and Immigrants from Senegal (74.0%, a difference of 0.070%).
| Demographics | Rating | Rank | In Labor Force | Age 20-24 |
| Immigrants | Japan | 3.0 /100 | #238 | Tragic 74.1% |
| Immigrants | Latin America | 2.7 /100 | #239 | Tragic 74.1% |
| Immigrants | Sri Lanka | 2.3 /100 | #240 | Tragic 74.0% |
| Immigrants | Senegal | 2.1 /100 | #241 | Tragic 74.0% |
| Thais | 2.1 /100 | #242 | Tragic 74.0% |
| Immigrants | Syria | 1.9 /100 | #243 | Tragic 74.0% |
| Immigrants | South Central Asia | 1.9 /100 | #244 | Tragic 74.0% |
| Turks | 1.8 /100 | #245 | Tragic 73.9% |
| Immigrants | Panama | 1.6 /100 | #246 | Tragic 73.9% |
| Colville | 1.5 /100 | #247 | Tragic 73.9% |
| Immigrants | Saudi Arabia | 1.5 /100 | #248 | Tragic 73.9% |
| Blacks/African Americans | 1.3 /100 | #249 | Tragic 73.9% |
| Immigrants | Belgium | 1.3 /100 | #250 | Tragic 73.9% |
| Immigrants | Egypt | 1.2 /100 | #251 | Tragic 73.8% |
| Immigrants | Kazakhstan | 1.1 /100 | #252 | Tragic 73.8% |