Immigrants from Hong Kong vs Immigrants from Oceania In Labor Force | Age > 16
COMPARE
Immigrants from Hong Kong
Immigrants from Oceania
In Labor Force | Age > 16
In Labor Force | Age > 16 Comparison
Immigrants from Hong Kong
Immigrants from Oceania
65.7%
IN LABOR FORCE | AGE > 16
96.2/ 100
METRIC RATING
120th/ 347
METRIC RANK
65.5%
IN LABOR FORCE | AGE > 16
87.5/ 100
METRIC RATING
147th/ 347
METRIC RANK
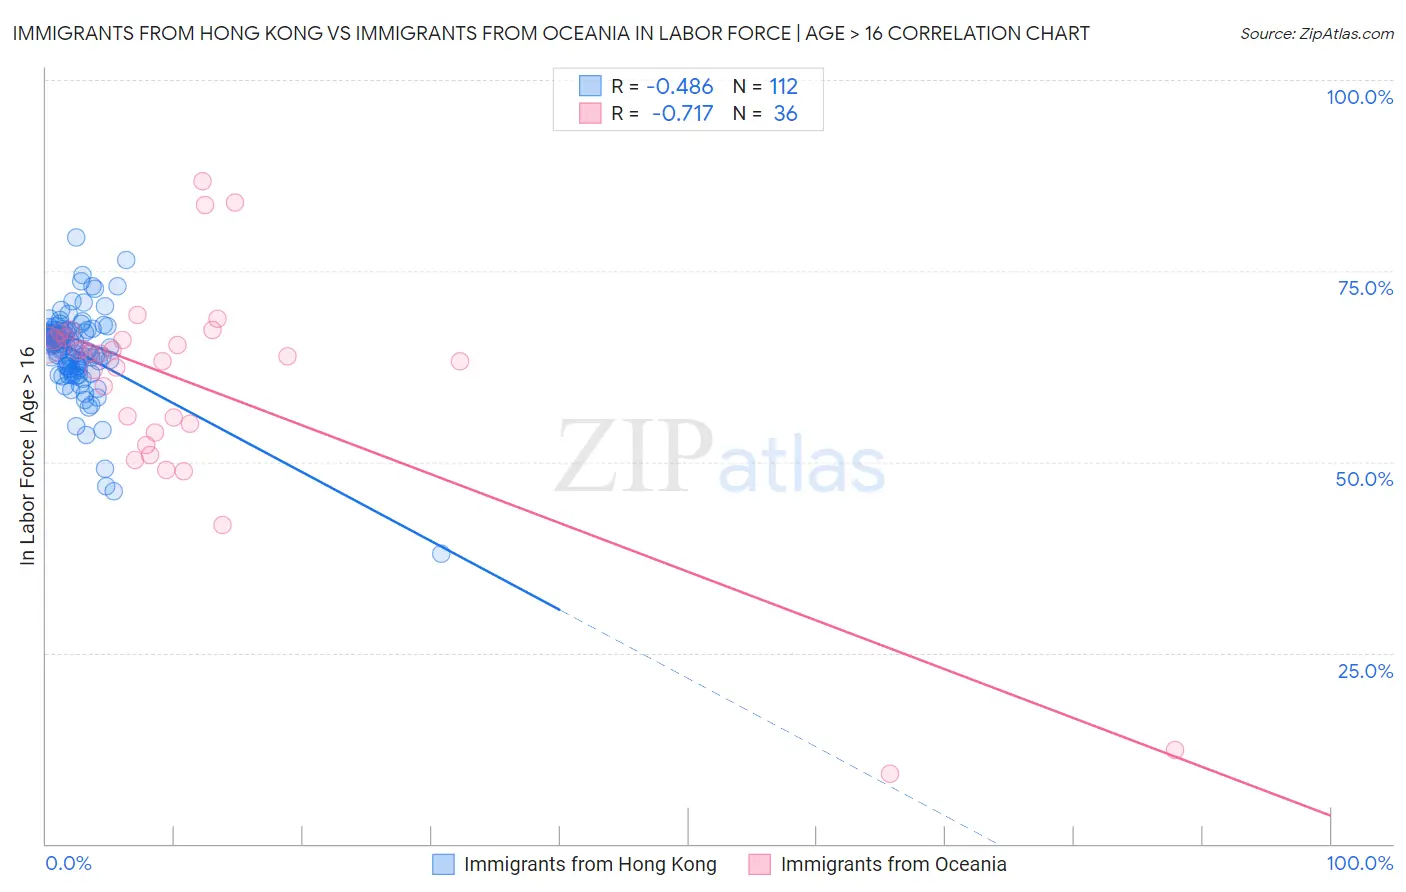
Immigrants from Hong Kong vs Immigrants from Oceania In Labor Force | Age > 16 Correlation Chart
The statistical analysis conducted on geographies consisting of 254,003,180 people shows a moderate negative correlation between the proportion of Immigrants from Hong Kong and labor force participation rate among population ages 16 and over in the United States with a correlation coefficient (R) of -0.486 and weighted average of 65.7%. Similarly, the statistical analysis conducted on geographies consisting of 305,520,725 people shows a strong negative correlation between the proportion of Immigrants from Oceania and labor force participation rate among population ages 16 and over in the United States with a correlation coefficient (R) of -0.717 and weighted average of 65.5%, a difference of 0.36%.
In Labor Force | Age > 16 Correlation Summary
| Measurement | Immigrants from Hong Kong | Immigrants from Oceania |
| Minimum | 38.0% | 9.1% |
| Maximum | 79.4% | 86.8% |
| Range | 41.4% | 77.7% |
| Mean | 64.4% | 59.8% |
| Median | 65.4% | 63.9% |
| Interquartile 25% (IQ1) | 62.3% | 54.4% |
| Interquartile 75% (IQ3) | 67.1% | 66.1% |
| Interquartile Range (IQR) | 4.8% | 11.7% |
| Standard Deviation (Sample) | 5.7% | 15.4% |
| Standard Deviation (Population) | 5.6% | 15.2% |
Similar Demographics by In Labor Force | Age > 16
Demographics Similar to Immigrants from Hong Kong by In Labor Force | Age > 16
In terms of in labor force | age > 16, the demographic groups most similar to Immigrants from Hong Kong are Immigrants from France (65.7%, a difference of 0.020%), New Zealander (65.7%, a difference of 0.020%), Immigrants from Ecuador (65.7%, a difference of 0.020%), Immigrants from Iran (65.7%, a difference of 0.030%), and Immigrants from Thailand (65.7%, a difference of 0.030%).
| Demographics | Rating | Rank | In Labor Force | Age > 16 |
| Pakistanis | 97.1 /100 | #113 | Exceptional 65.8% |
| Hondurans | 97.1 /100 | #114 | Exceptional 65.8% |
| Immigrants | Indonesia | 96.8 /100 | #115 | Exceptional 65.7% |
| Argentineans | 96.7 /100 | #116 | Exceptional 65.7% |
| Immigrants | Iran | 96.6 /100 | #117 | Exceptional 65.7% |
| Immigrants | Thailand | 96.6 /100 | #118 | Exceptional 65.7% |
| Immigrants | France | 96.4 /100 | #119 | Exceptional 65.7% |
| Immigrants | Hong Kong | 96.2 /100 | #120 | Exceptional 65.7% |
| New Zealanders | 96.0 /100 | #121 | Exceptional 65.7% |
| Immigrants | Ecuador | 95.9 /100 | #122 | Exceptional 65.7% |
| Immigrants | Iraq | 95.5 /100 | #123 | Exceptional 65.7% |
| Iraqis | 95.4 /100 | #124 | Exceptional 65.7% |
| Norwegians | 95.3 /100 | #125 | Exceptional 65.7% |
| Koreans | 95.3 /100 | #126 | Exceptional 65.7% |
| Immigrants | Eastern Asia | 94.9 /100 | #127 | Exceptional 65.7% |
Demographics Similar to Immigrants from Oceania by In Labor Force | Age > 16
In terms of in labor force | age > 16, the demographic groups most similar to Immigrants from Oceania are Tlingit-Haida (65.5%, a difference of 0.020%), Cypriot (65.5%, a difference of 0.020%), Immigrants from Romania (65.5%, a difference of 0.030%), Bhutanese (65.5%, a difference of 0.030%), and Immigrants from Albania (65.4%, a difference of 0.040%).
| Demographics | Rating | Rank | In Labor Force | Age > 16 |
| Immigrants | Costa Rica | 90.8 /100 | #140 | Exceptional 65.5% |
| Samoans | 90.5 /100 | #141 | Exceptional 65.5% |
| Indians (Asian) | 89.5 /100 | #142 | Excellent 65.5% |
| Latvians | 89.4 /100 | #143 | Excellent 65.5% |
| Immigrants | Romania | 88.6 /100 | #144 | Excellent 65.5% |
| Tlingit-Haida | 88.3 /100 | #145 | Excellent 65.5% |
| Cypriots | 88.2 /100 | #146 | Excellent 65.5% |
| Immigrants | Oceania | 87.5 /100 | #147 | Excellent 65.5% |
| Bhutanese | 86.3 /100 | #148 | Excellent 65.5% |
| Immigrants | Albania | 85.7 /100 | #149 | Excellent 65.4% |
| Immigrants | Immigrants | 81.9 /100 | #150 | Excellent 65.4% |
| Czechs | 81.5 /100 | #151 | Excellent 65.4% |
| Yugoslavians | 81.3 /100 | #152 | Excellent 65.4% |
| Immigrants | China | 80.5 /100 | #153 | Excellent 65.4% |
| Immigrants | Eastern Europe | 78.3 /100 | #154 | Good 65.4% |