Immigrants from Hong Kong vs Belgian In Labor Force | Age > 16
COMPARE
Immigrants from Hong Kong
Belgian
In Labor Force | Age > 16
In Labor Force | Age > 16 Comparison
Immigrants from Hong Kong
Belgians
65.7%
IN LABOR FORCE | AGE > 16
96.2/ 100
METRIC RATING
120th/ 347
METRIC RANK
64.7%
IN LABOR FORCE | AGE > 16
11.4/ 100
METRIC RATING
216th/ 347
METRIC RANK
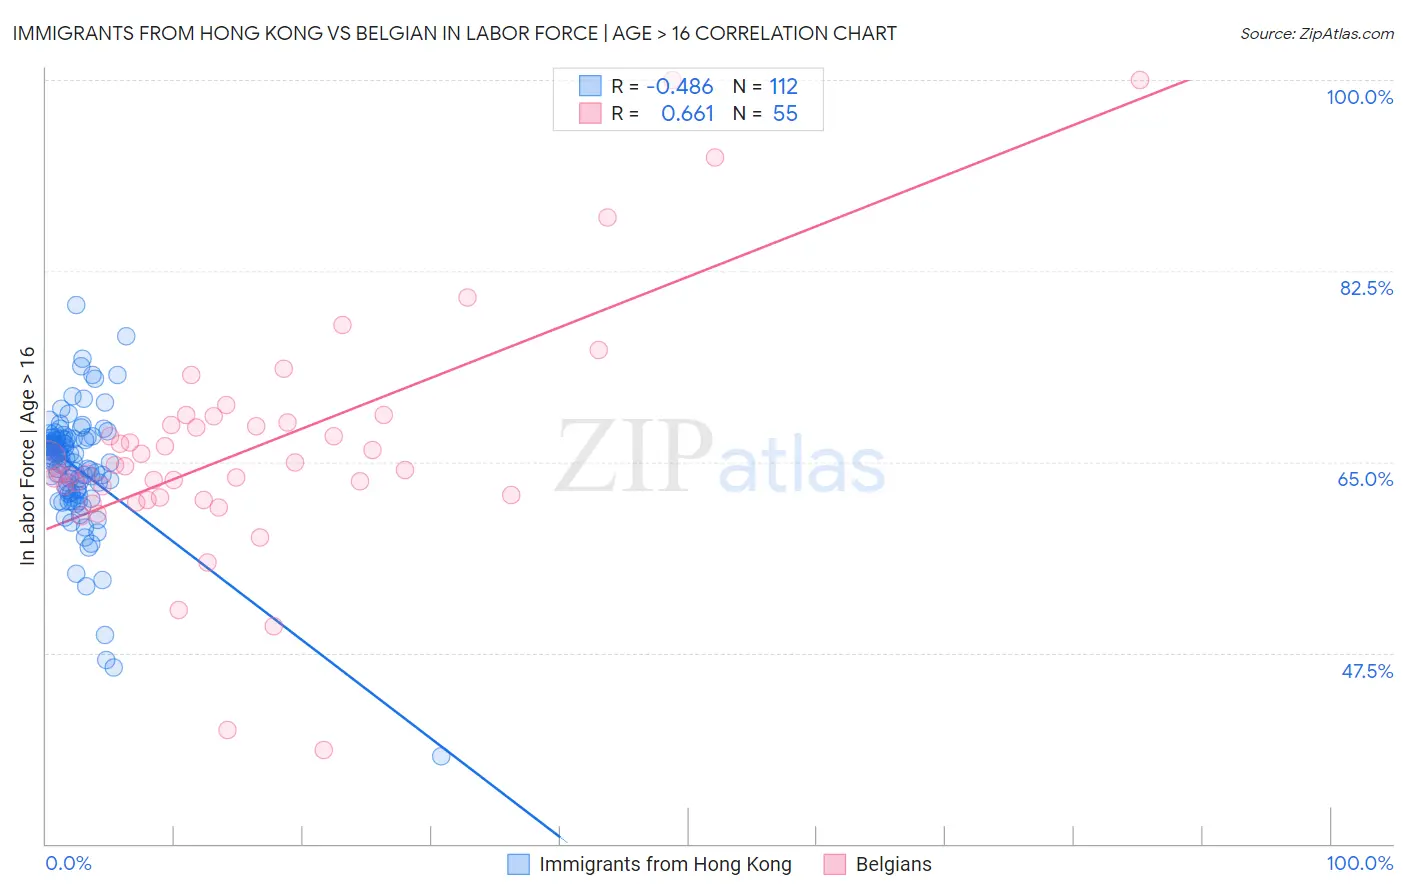
Immigrants from Hong Kong vs Belgian In Labor Force | Age > 16 Correlation Chart
The statistical analysis conducted on geographies consisting of 254,003,180 people shows a moderate negative correlation between the proportion of Immigrants from Hong Kong and labor force participation rate among population ages 16 and over in the United States with a correlation coefficient (R) of -0.486 and weighted average of 65.7%. Similarly, the statistical analysis conducted on geographies consisting of 356,033,216 people shows a significant positive correlation between the proportion of Belgians and labor force participation rate among population ages 16 and over in the United States with a correlation coefficient (R) of 0.661 and weighted average of 64.7%, a difference of 1.5%.
In Labor Force | Age > 16 Correlation Summary
| Measurement | Immigrants from Hong Kong | Belgian |
| Minimum | 38.0% | 38.6% |
| Maximum | 79.4% | 100.0% |
| Range | 41.4% | 61.4% |
| Mean | 64.4% | 66.2% |
| Median | 65.4% | 64.6% |
| Interquartile 25% (IQ1) | 62.3% | 61.8% |
| Interquartile 75% (IQ3) | 67.1% | 68.6% |
| Interquartile Range (IQR) | 4.8% | 6.8% |
| Standard Deviation (Sample) | 5.7% | 10.9% |
| Standard Deviation (Population) | 5.6% | 10.8% |
Similar Demographics by In Labor Force | Age > 16
Demographics Similar to Immigrants from Hong Kong by In Labor Force | Age > 16
In terms of in labor force | age > 16, the demographic groups most similar to Immigrants from Hong Kong are Immigrants from France (65.7%, a difference of 0.020%), New Zealander (65.7%, a difference of 0.020%), Immigrants from Ecuador (65.7%, a difference of 0.020%), Immigrants from Iran (65.7%, a difference of 0.030%), and Immigrants from Thailand (65.7%, a difference of 0.030%).
| Demographics | Rating | Rank | In Labor Force | Age > 16 |
| Pakistanis | 97.1 /100 | #113 | Exceptional 65.8% |
| Hondurans | 97.1 /100 | #114 | Exceptional 65.8% |
| Immigrants | Indonesia | 96.8 /100 | #115 | Exceptional 65.7% |
| Argentineans | 96.7 /100 | #116 | Exceptional 65.7% |
| Immigrants | Iran | 96.6 /100 | #117 | Exceptional 65.7% |
| Immigrants | Thailand | 96.6 /100 | #118 | Exceptional 65.7% |
| Immigrants | France | 96.4 /100 | #119 | Exceptional 65.7% |
| Immigrants | Hong Kong | 96.2 /100 | #120 | Exceptional 65.7% |
| New Zealanders | 96.0 /100 | #121 | Exceptional 65.7% |
| Immigrants | Ecuador | 95.9 /100 | #122 | Exceptional 65.7% |
| Immigrants | Iraq | 95.5 /100 | #123 | Exceptional 65.7% |
| Iraqis | 95.4 /100 | #124 | Exceptional 65.7% |
| Norwegians | 95.3 /100 | #125 | Exceptional 65.7% |
| Koreans | 95.3 /100 | #126 | Exceptional 65.7% |
| Immigrants | Eastern Asia | 94.9 /100 | #127 | Exceptional 65.7% |
Demographics Similar to Belgians by In Labor Force | Age > 16
In terms of in labor force | age > 16, the demographic groups most similar to Belgians are U.S. Virgin Islander (64.7%, a difference of 0.0%), Immigrants from Czechoslovakia (64.8%, a difference of 0.020%), Alsatian (64.7%, a difference of 0.020%), Immigrants from Central America (64.7%, a difference of 0.020%), and Alaska Native (64.7%, a difference of 0.040%).
| Demographics | Rating | Rank | In Labor Force | Age > 16 |
| Immigrants | Trinidad and Tobago | 15.6 /100 | #209 | Poor 64.8% |
| Immigrants | Denmark | 14.7 /100 | #210 | Poor 64.8% |
| Fijians | 14.1 /100 | #211 | Poor 64.8% |
| Alaskan Athabascans | 13.9 /100 | #212 | Poor 64.8% |
| Maltese | 13.8 /100 | #213 | Poor 64.8% |
| Estonians | 13.1 /100 | #214 | Poor 64.8% |
| Immigrants | Czechoslovakia | 12.3 /100 | #215 | Poor 64.8% |
| Belgians | 11.4 /100 | #216 | Poor 64.7% |
| U.S. Virgin Islanders | 11.3 /100 | #217 | Poor 64.7% |
| Alsatians | 10.7 /100 | #218 | Poor 64.7% |
| Immigrants | Central America | 10.5 /100 | #219 | Poor 64.7% |
| Alaska Natives | 9.9 /100 | #220 | Tragic 64.7% |
| Immigrants | Micronesia | 9.6 /100 | #221 | Tragic 64.7% |
| Hawaiians | 9.3 /100 | #222 | Tragic 64.7% |
| Immigrants | Belize | 9.2 /100 | #223 | Tragic 64.7% |