Immigrants from India vs Immigrants from Oceania In Labor Force | Age > 16
COMPARE
Immigrants from India
Immigrants from Oceania
In Labor Force | Age > 16
In Labor Force | Age > 16 Comparison
Immigrants from India
Immigrants from Oceania
67.6%
IN LABOR FORCE | AGE > 16
100.0/ 100
METRIC RATING
17th/ 347
METRIC RANK
65.5%
IN LABOR FORCE | AGE > 16
87.5/ 100
METRIC RATING
147th/ 347
METRIC RANK
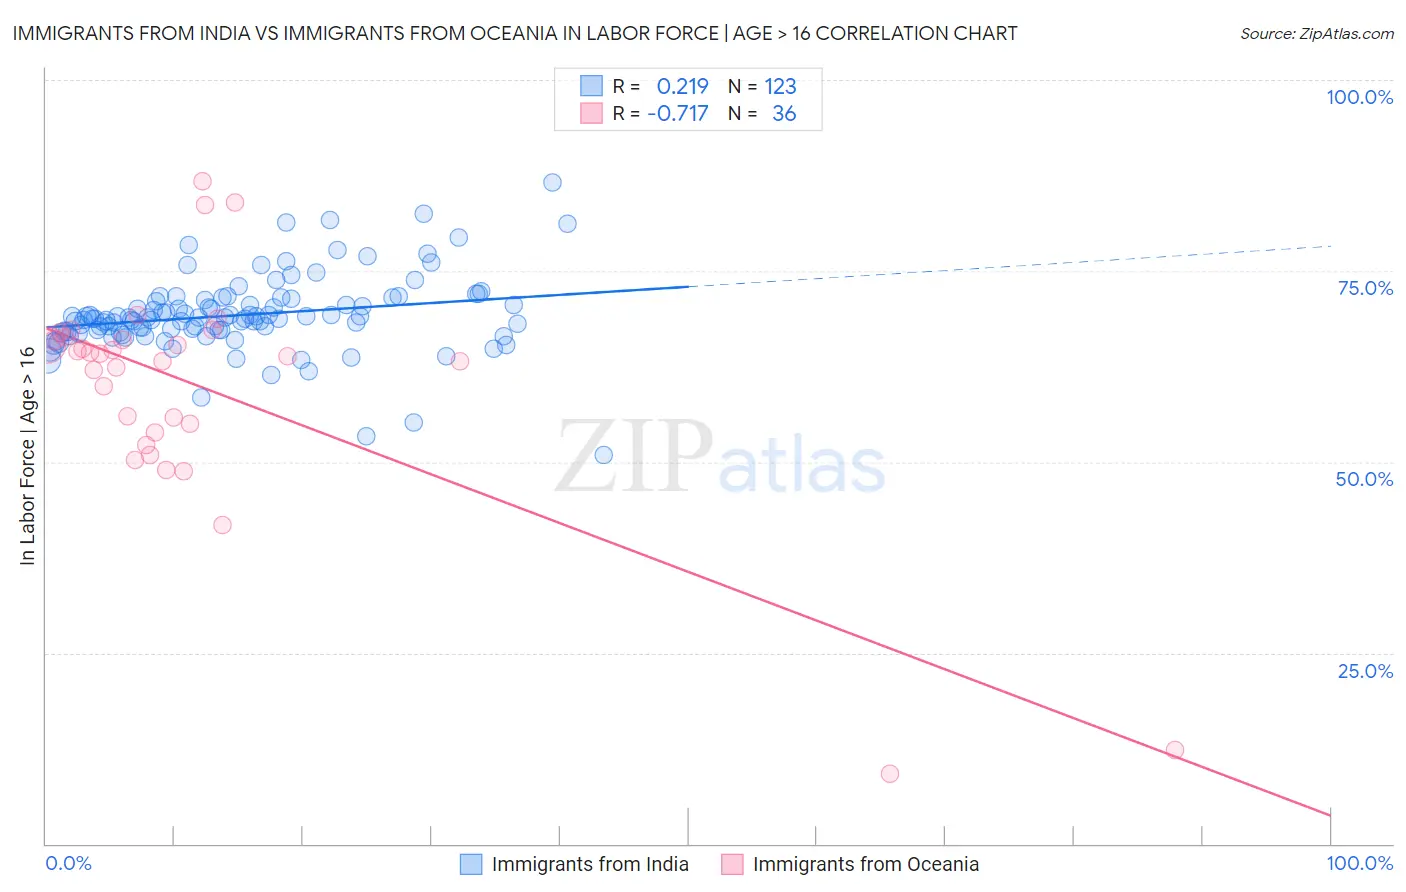
Immigrants from India vs Immigrants from Oceania In Labor Force | Age > 16 Correlation Chart
The statistical analysis conducted on geographies consisting of 434,131,731 people shows a weak positive correlation between the proportion of Immigrants from India and labor force participation rate among population ages 16 and over in the United States with a correlation coefficient (R) of 0.219 and weighted average of 67.6%. Similarly, the statistical analysis conducted on geographies consisting of 305,520,725 people shows a strong negative correlation between the proportion of Immigrants from Oceania and labor force participation rate among population ages 16 and over in the United States with a correlation coefficient (R) of -0.717 and weighted average of 65.5%, a difference of 3.3%.
In Labor Force | Age > 16 Correlation Summary
| Measurement | Immigrants from India | Immigrants from Oceania |
| Minimum | 50.9% | 9.1% |
| Maximum | 86.5% | 86.8% |
| Range | 35.6% | 77.7% |
| Mean | 69.2% | 59.8% |
| Median | 68.8% | 63.9% |
| Interquartile 25% (IQ1) | 67.1% | 54.4% |
| Interquartile 75% (IQ3) | 71.2% | 66.1% |
| Interquartile Range (IQR) | 4.1% | 11.7% |
| Standard Deviation (Sample) | 5.1% | 15.4% |
| Standard Deviation (Population) | 5.0% | 15.2% |
Similar Demographics by In Labor Force | Age > 16
Demographics Similar to Immigrants from India by In Labor Force | Age > 16
In terms of in labor force | age > 16, the demographic groups most similar to Immigrants from India are Immigrants from Liberia (67.6%, a difference of 0.020%), Kenyan (67.6%, a difference of 0.050%), Immigrants from Sudan (67.7%, a difference of 0.070%), Immigrants from Kenya (67.6%, a difference of 0.10%), and Tongan (67.5%, a difference of 0.12%).
| Demographics | Rating | Rank | In Labor Force | Age > 16 |
| Immigrants | Bolivia | 100.0 /100 | #10 | Exceptional 68.4% |
| Bolivians | 100.0 /100 | #11 | Exceptional 68.2% |
| Sudanese | 100.0 /100 | #12 | Exceptional 68.0% |
| Immigrants | Nepal | 100.0 /100 | #13 | Exceptional 68.0% |
| Liberians | 100.0 /100 | #14 | Exceptional 67.8% |
| Immigrants | Middle Africa | 100.0 /100 | #15 | Exceptional 67.7% |
| Immigrants | Sudan | 100.0 /100 | #16 | Exceptional 67.7% |
| Immigrants | India | 100.0 /100 | #17 | Exceptional 67.6% |
| Immigrants | Liberia | 100.0 /100 | #18 | Exceptional 67.6% |
| Kenyans | 100.0 /100 | #19 | Exceptional 67.6% |
| Immigrants | Kenya | 100.0 /100 | #20 | Exceptional 67.6% |
| Tongans | 100.0 /100 | #21 | Exceptional 67.5% |
| Immigrants | Uganda | 100.0 /100 | #22 | Exceptional 67.5% |
| Cambodians | 100.0 /100 | #23 | Exceptional 67.4% |
| Ugandans | 100.0 /100 | #24 | Exceptional 67.4% |
Demographics Similar to Immigrants from Oceania by In Labor Force | Age > 16
In terms of in labor force | age > 16, the demographic groups most similar to Immigrants from Oceania are Tlingit-Haida (65.5%, a difference of 0.020%), Cypriot (65.5%, a difference of 0.020%), Immigrants from Romania (65.5%, a difference of 0.030%), Bhutanese (65.5%, a difference of 0.030%), and Immigrants from Albania (65.4%, a difference of 0.040%).
| Demographics | Rating | Rank | In Labor Force | Age > 16 |
| Immigrants | Costa Rica | 90.8 /100 | #140 | Exceptional 65.5% |
| Samoans | 90.5 /100 | #141 | Exceptional 65.5% |
| Indians (Asian) | 89.5 /100 | #142 | Excellent 65.5% |
| Latvians | 89.4 /100 | #143 | Excellent 65.5% |
| Immigrants | Romania | 88.6 /100 | #144 | Excellent 65.5% |
| Tlingit-Haida | 88.3 /100 | #145 | Excellent 65.5% |
| Cypriots | 88.2 /100 | #146 | Excellent 65.5% |
| Immigrants | Oceania | 87.5 /100 | #147 | Excellent 65.5% |
| Bhutanese | 86.3 /100 | #148 | Excellent 65.5% |
| Immigrants | Albania | 85.7 /100 | #149 | Excellent 65.4% |
| Immigrants | Immigrants | 81.9 /100 | #150 | Excellent 65.4% |
| Czechs | 81.5 /100 | #151 | Excellent 65.4% |
| Yugoslavians | 81.3 /100 | #152 | Excellent 65.4% |
| Immigrants | China | 80.5 /100 | #153 | Excellent 65.4% |
| Immigrants | Eastern Europe | 78.3 /100 | #154 | Good 65.4% |